- Sweden
- /
- Hospitality
- /
- OM:EVO
Evolution (STO:EVO) sheds 4.0% this week, as yearly returns fall more in line with earnings growth


While Evolution AB (publ) (STO:EVO) shareholders are probably generally happy, the stock hasn't had particularly good run recently, with the share price falling 20% in the last quarter. But over five years returns have been remarkably great. To be precise, the stock price is 484% higher than it was five years ago, a wonderful performance by any measure. Arguably, the recent fall is to be expected after such a strong rise. The most important thing for savvy investors to consider is whether the underlying business can justify the share price gain.
While the stock has fallen 4.0% this week, it's worth focusing on the longer term and seeing if the stocks historical returns have been driven by the underlying fundamentals.
See our latest analysis for Evolution
While the efficient markets hypothesis continues to be taught by some, it has been proven that markets are over-reactive dynamic systems, and investors are not always rational. By comparing earnings per share (EPS) and share price changes over time, we can get a feel for how investor attitudes to a company have morphed over time.
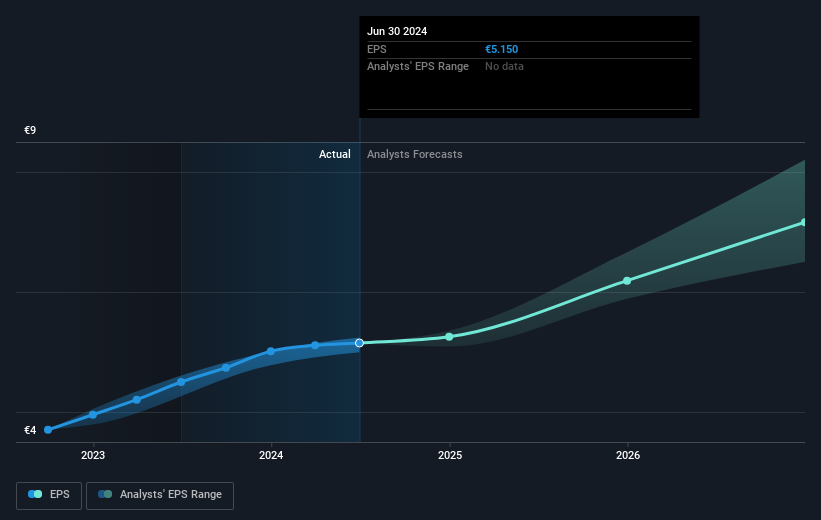
During five years of share price growth, Evolution achieved compound earnings per share (EPS) growth of 53% per year. The EPS growth is more impressive than the yearly share price gain of 42% over the same period. So it seems the market isn't so enthusiastic about the stock these days.
The image below shows how EPS has tracked over time (if you click on the image you can see greater detail).
We consider it positive that insiders have made significant purchases in the last year. Having said that, most people consider earnings and revenue growth trends to be a more meaningful guide to the business. It might be well worthwhile taking a look at our free report on Evolution's earnings, revenue and cash flow.
What About Dividends?
As well as measuring the share price return, investors should also consider the total shareholder return (TSR). Whereas the share price return only reflects the change in the share price, the TSR includes the value of dividends (assuming they were reinvested) and the benefit of any discounted capital raising or spin-off. It's fair to say that the TSR gives a more complete picture for stocks that pay a dividend. In the case of Evolution, it has a TSR of 525% for the last 5 years. That exceeds its share price return that we previously mentioned. The dividends paid by the company have thusly boosted the total shareholder return.
A Different Perspective
While the broader market gained around 14% in the last year, Evolution shareholders lost 20% (even including dividends). Even the share prices of good stocks drop sometimes, but we want to see improvements in the fundamental metrics of a business, before getting too interested. On the bright side, long term shareholders have made money, with a gain of 44% per year over half a decade. It could be that the recent sell-off is an opportunity, so it may be worth checking the fundamental data for signs of a long term growth trend. It's always interesting to track share price performance over the longer term. But to understand Evolution better, we need to consider many other factors. For example, we've discovered 1 warning sign for Evolution that you should be aware of before investing here.
Evolution is not the only stock that insiders are buying. For those who like to find lesser know companies this free list of growing companies with recent insider purchasing, could be just the ticket.
Please note, the market returns quoted in this article reflect the market weighted average returns of stocks that currently trade on Swedish exchanges.
Valuation is complex, but we're here to simplify it.
Discover if Evolution might be undervalued or overvalued with our detailed analysis, featuring fair value estimates, potential risks, dividends, insider trades, and its financial condition.
Access Free AnalysisHave feedback on this article? Concerned about the content? Get in touch with us directly. Alternatively, email editorial-team (at) simplywallst.com.
This article by Simply Wall St is general in nature. We provide commentary based on historical data and analyst forecasts only using an unbiased methodology and our articles are not intended to be financial advice. It does not constitute a recommendation to buy or sell any stock, and does not take account of your objectives, or your financial situation. We aim to bring you long-term focused analysis driven by fundamental data. Note that our analysis may not factor in the latest price-sensitive company announcements or qualitative material. Simply Wall St has no position in any stocks mentioned.
About OM:EVO
Evolution
Develops, produces, markets, and licenses online casino systems to gaming operators in Europe, Asia, North America, Latin America, and internationally.
Flawless balance sheet and undervalued.
