
Advertisement
- Sweden
- /
- Consumer Durables
- /
- OM:WTW A
Investors Still Aren't Entirely Convinced By Wall to Wall Group AB's (STO:WTW A) Revenues Despite 26% Price Jump
Wall to Wall Group AB (STO:WTW A) shares have had a really impressive month, gaining 26% after a shaky period beforehand. Not all shareholders will be feeling jubilant, since the share price is still down a very disappointing 15% in the last twelve months.
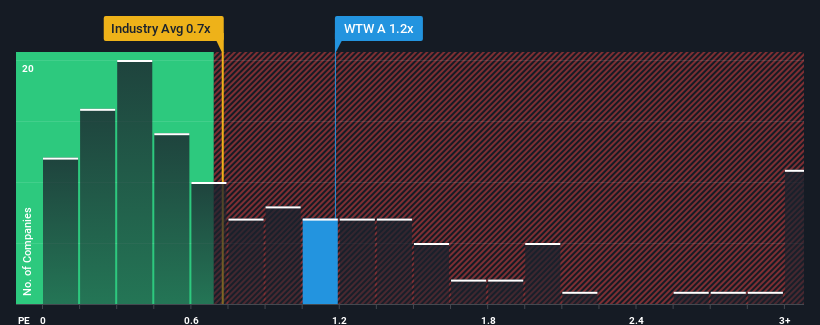
In spite of the firm bounce in price, you could still be forgiven for feeling indifferent about Wall to Wall Group's P/S ratio of 1.2x, since the median price-to-sales (or "P/S") ratio for the Consumer Durables industry in Sweden is also close to 0.9x. Although, it's not wise to simply ignore the P/S without explanation as investors may be disregarding a distinct opportunity or a costly mistake.
Check out our latest analysis for Wall to Wall Group
What Does Wall to Wall Group's Recent Performance Look Like?
Wall to Wall Group has been doing a good job lately as it's been growing revenue at a solid pace. It might be that many expect the respectable revenue performance to wane, which has kept the P/S from rising. If you like the company, you'd be hoping this isn't the case so that you could potentially pick up some stock while it's not quite in favour.
We don't have analyst forecasts, but you can see how recent trends are setting up the company for the future by checking out our free report on Wall to Wall Group's earnings, revenue and cash flow.What Are Revenue Growth Metrics Telling Us About The P/S?
Wall to Wall Group's P/S ratio would be typical for a company that's only expected to deliver moderate growth, and importantly, perform in line with the industry.
Taking a look back first, we see that the company grew revenue by an impressive 23% last year. Still, revenue has barely risen at all from three years ago in total, which is not ideal. So it appears to us that the company has had a mixed result in terms of growing revenue over that time.
In contrast to the company, the rest of the industry is expected to decline by 1.0% over the next year, which puts the company's recent medium-term positive growth rates in a good light for now.
With this in mind, we find it intriguing that Wall to Wall Group's P/S matches its industry peers. It looks like most investors are not convinced the company can maintain its recent positive growth rate in the face of a shrinking broader industry.
What Does Wall to Wall Group's P/S Mean For Investors?
Wall to Wall Group appears to be back in favour with a solid price jump bringing its P/S back in line with other companies in the industry It's argued the price-to-sales ratio is an inferior measure of value within certain industries, but it can be a powerful business sentiment indicator.
As mentioned previously, Wall to Wall Group currently trades on a P/S on par with the wider industry, but this is lower than expected considering its recent three-year revenue growth is beating forecasts for a struggling industry. There could be some unobserved threats to revenue preventing the P/S ratio from outpacing the industry much like its revenue performance. One major risk is whether its revenue trajectory can keep outperforming under these tough industry conditions. It appears some are indeed anticipating revenue instability, because this relative performance should normally provide a boost to the share price.
There are also other vital risk factors to consider before investing and we've discovered 1 warning sign for Wall to Wall Group that you should be aware of.
Of course, profitable companies with a history of great earnings growth are generally safer bets. So you may wish to see this free collection of other companies that have reasonable P/E ratios and have grown earnings strongly.
Valuation is complex, but we're here to simplify it.
Discover if Wall to Wall Group might be undervalued or overvalued with our detailed analysis, featuring fair value estimates, potential risks, dividends, insider trades, and its financial condition.
Access Free AnalysisHave feedback on this article? Concerned about the content? Get in touch with us directly. Alternatively, email editorial-team (at) simplywallst.com.
This article by Simply Wall St is general in nature. We provide commentary based on historical data and analyst forecasts only using an unbiased methodology and our articles are not intended to be financial advice. It does not constitute a recommendation to buy or sell any stock, and does not take account of your objectives, or your financial situation. We aim to bring you long-term focused analysis driven by fundamental data. Note that our analysis may not factor in the latest price-sensitive company announcements or qualitative material. Simply Wall St has no position in any stocks mentioned.
About OM:WTW A
Wall to Wall Group
Provides pipe lining and flushing, pipe inspection, maintenance and sealing of ventilation ducts, and other complementary and related services in the Nordic region.
Adequate balance sheet and fair value.
Market Insights

Advertisement
Community Narratives
MicroVision will explode future revenue by 380.37% with a vision towards success
Fair Value US$60|98.4% undervalued
TH
Community Contributor
The Indispensable Artery for a New North American Economy
Fair Value CA$132.87|3.6% undervalued
TI
Community Contributor
Recently Updated Narratives
BE


Bejgal on MINISO Group Holding ·
MINISO's fair value is projected at 26.69 with an anticipated PE ratio shift of 20x
Fair Value:US$26.6927.9% undervalued
43 followersusers have followed this narrative
3 commentsusers have commented on this narrative
0 likesusers have liked this narrative
TI


TickerTickle on Oracle ·
The Quiet Giant That Became AI’s Power Grid
Fair Value:US$389.8148.6% undervalued
6 followersusers have followed this narrative
0 commentsusers have commented on this narrative
0 likesusers have liked this narrative
AU

AuCA on Nova Ljubljanska Banka d.d ·
Nova Ljubljanska Banka d.d will expect a 11.2% revenue boost driving future growth
Fair Value:€20916.0% undervalued
23 followersusers have followed this narrative
3 commentsusers have commented on this narrative
0 likesusers have liked this narrative
Popular Narratives
OS


oscargarcia on Alphabet ·
The company that turned a verb into a global necessity and basically runs the modern internet, digital ads, smartphones, maps, and AI.
Fair Value:US$3406.3% undervalued
130 followersusers have followed this narrative
6 commentsusers have commented on this narrative
17 likesusers have liked this narrative
TH

TheWallstreetKing on MicroVision ·
MicroVision will explode future revenue by 380.37% with a vision towards success
Fair Value:US$6098.4% undervalued
81 followersusers have followed this narrative
10 commentsusers have commented on this narrative
18 likesusers have liked this narrative
AN


AnalystConsensusTarget on NVIDIA ·
NVDA: Expanding AI Demand Will Drive Major Data Center Investments Through 2026
Fair Value:US$232.7921.6% undervalued
918 followersusers have followed this narrative
5 commentsusers have commented on this narrative
21 likesusers have liked this narrative