
Advertisement
Here's Why Thule Group (STO:THULE) Can Manage Its Debt Responsibly
Howard Marks put it nicely when he said that, rather than worrying about share price volatility, 'The possibility of permanent loss is the risk I worry about... and every practical investor I know worries about.' When we think about how risky a company is, we always like to look at its use of debt, since debt overload can lead to ruin. As with many other companies Thule Group AB (publ) (STO:THULE) makes use of debt. But the real question is whether this debt is making the company risky.
Why Does Debt Bring Risk?
Debt and other liabilities become risky for a business when it cannot easily fulfill those obligations, either with free cash flow or by raising capital at an attractive price. If things get really bad, the lenders can take control of the business. However, a more common (but still painful) scenario is that it has to raise new equity capital at a low price, thus permanently diluting shareholders. Of course, debt can be an important tool in businesses, particularly capital heavy businesses. The first step when considering a company's debt levels is to consider its cash and debt together.
View our latest analysis for Thule Group
How Much Debt Does Thule Group Carry?
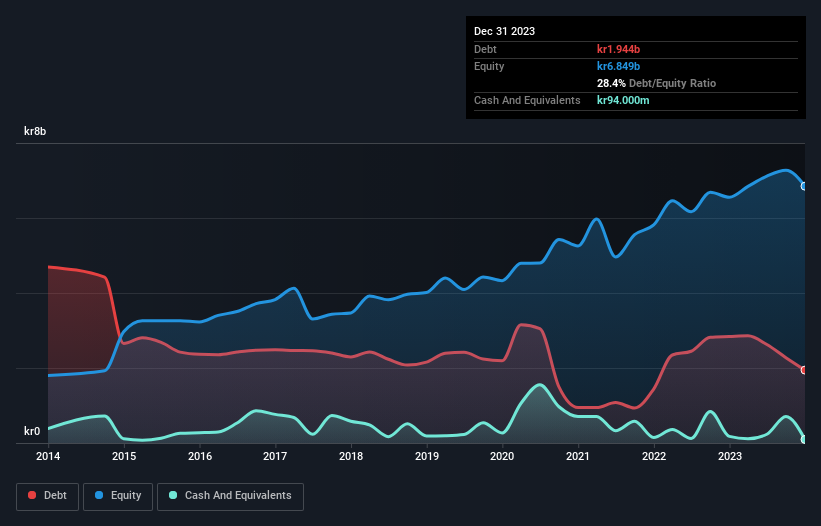
You can click the graphic below for the historical numbers, but it shows that Thule Group had kr1.94b of debt in December 2023, down from kr2.84b, one year before. However, it also had kr94.0m in cash, and so its net debt is kr1.85b.
A Look At Thule Group's Liabilities
Zooming in on the latest balance sheet data, we can see that Thule Group had liabilities of kr1.48b due within 12 months and liabilities of kr2.64b due beyond that. On the other hand, it had cash of kr94.0m and kr1.08b worth of receivables due within a year. So its liabilities outweigh the sum of its cash and (near-term) receivables by kr2.95b.
Of course, Thule Group has a market capitalization of kr31.7b, so these liabilities are probably manageable. But there are sufficient liabilities that we would certainly recommend shareholders continue to monitor the balance sheet, going forward.
In order to size up a company's debt relative to its earnings, we calculate its net debt divided by its earnings before interest, tax, depreciation, and amortization (EBITDA) and its earnings before interest and tax (EBIT) divided by its interest expense (its interest cover). This way, we consider both the absolute quantum of the debt, as well as the interest rates paid on it.
Thule Group has a low net debt to EBITDA ratio of only 1.0. And its EBIT easily covers its interest expense, being 23.9 times the size. So you could argue it is no more threatened by its debt than an elephant is by a mouse. On the other hand, Thule Group's EBIT dived 12%, over the last year. If that rate of decline in earnings continues, the company could find itself in a tight spot. There's no doubt that we learn most about debt from the balance sheet. But it is future earnings, more than anything, that will determine Thule Group's ability to maintain a healthy balance sheet going forward. So if you're focused on the future you can check out this free report showing analyst profit forecasts.
Finally, a company can only pay off debt with cold hard cash, not accounting profits. So we always check how much of that EBIT is translated into free cash flow. Looking at the most recent three years, Thule Group recorded free cash flow of 43% of its EBIT, which is weaker than we'd expect. That weak cash conversion makes it more difficult to handle indebtedness.
Our View
On our analysis Thule Group's interest cover should signal that it won't have too much trouble with its debt. However, our other observations weren't so heartening. For example, its EBIT growth rate makes us a little nervous about its debt. Considering this range of data points, we think Thule Group is in a good position to manage its debt levels. Having said that, the load is sufficiently heavy that we would recommend any shareholders keep a close eye on it. The balance sheet is clearly the area to focus on when you are analysing debt. However, not all investment risk resides within the balance sheet - far from it. For example - Thule Group has 1 warning sign we think you should be aware of.
If, after all that, you're more interested in a fast growing company with a rock-solid balance sheet, then check out our list of net cash growth stocks without delay.
Valuation is complex, but we're here to simplify it.
Discover if Thule Group might be undervalued or overvalued with our detailed analysis, featuring fair value estimates, potential risks, dividends, insider trades, and its financial condition.
Access Free AnalysisHave feedback on this article? Concerned about the content? Get in touch with us directly. Alternatively, email editorial-team (at) simplywallst.com.
This article by Simply Wall St is general in nature. We provide commentary based on historical data and analyst forecasts only using an unbiased methodology and our articles are not intended to be financial advice. It does not constitute a recommendation to buy or sell any stock, and does not take account of your objectives, or your financial situation. We aim to bring you long-term focused analysis driven by fundamental data. Note that our analysis may not factor in the latest price-sensitive company announcements or qualitative material. Simply Wall St has no position in any stocks mentioned.
About OM:THULE
Undervalued average dividend payer.
Similar Companies
Market Insights

Advertisement
Community Narratives
MicroVision will explode future revenue by 380.37% with a vision towards success
Fair Value US$60.00|98.4% undervalued
TH
Community Contributor
The Indispensable Artery for a New North American Economy
Fair Value CA$132.87|1.3% undervalued
TI
Community Contributor