- Sweden
- /
- Consumer Durables
- /
- OM:STRAX
The Market Doesn't Like What It Sees From Strax AB (publ)'s (STO:STRAX) Revenues Yet As Shares Tumble 26%

The Strax AB (publ) (STO:STRAX) share price has fared very poorly over the last month, falling by a substantial 26%. The recent drop completes a disastrous twelve months for shareholders, who are sitting on a 79% loss during that time.
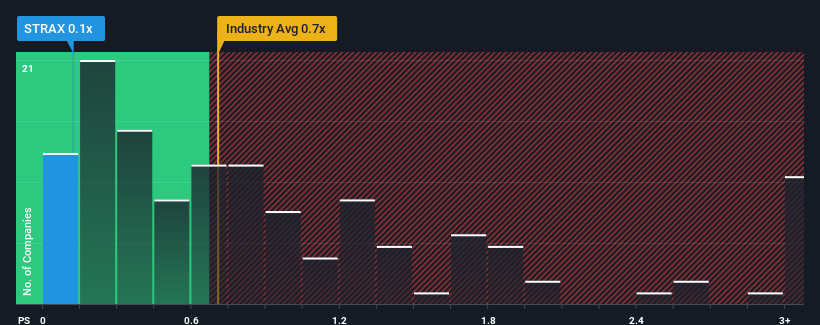
After such a large drop in price, when close to half the companies operating in Sweden's Consumer Durables industry have price-to-sales ratios (or "P/S") above 0.9x, you may consider Strax as an enticing stock to check out with its 0.1x P/S ratio. Nonetheless, we'd need to dig a little deeper to determine if there is a rational basis for the reduced P/S.
Check out our latest analysis for Strax
How Has Strax Performed Recently?
As an illustration, revenue has deteriorated at Strax over the last year, which is not ideal at all. Perhaps the market believes the recent revenue performance isn't good enough to keep up the industry, causing the P/S ratio to suffer. However, if this doesn't eventuate then existing shareholders may be feeling optimistic about the future direction of the share price.
We don't have analyst forecasts, but you can see how recent trends are setting up the company for the future by checking out our free report on Strax's earnings, revenue and cash flow.How Is Strax's Revenue Growth Trending?
In order to justify its P/S ratio, Strax would need to produce sluggish growth that's trailing the industry.
In reviewing the last year of financials, we were disheartened to see the company's revenues fell to the tune of 49%. The last three years don't look nice either as the company has shrunk revenue by 81% in aggregate. So unfortunately, we have to acknowledge that the company has not done a great job of growing revenue over that time.
This is in contrast to the rest of the industry, which is expected to decline by 4.9% over the next year, or less than the company's recent medium-term annualised revenue decline.
With this information, it's not too hard to see why Strax is trading at a lower P/S in comparison. However, when revenue shrink rapidly P/S often shrinks too, which could set up shareholders for future disappointment regardless. There's potential for the P/S to fall to even lower levels if the company doesn't improve its top-line growth, which would be difficult to do with the current industry outlook.
The Final Word
Strax's recently weak share price has pulled its P/S back below other Consumer Durables companies. It's argued the price-to-sales ratio is an inferior measure of value within certain industries, but it can be a powerful business sentiment indicator.
It's clear that Strax trades at a low P/S relative to the wider industry on the weakness of its recent three-year revenue being even worse than the forecasts for a struggling industry, as expected. Right now shareholders are accepting the low P/S as they concede future revenue probably won't provide any pleasant surprises. However, we're still cautious about the company's ability to prevent an acceleration of its recent medium-term course and resist even greater pain to its business from the broader industry turmoil. For now though, it's hard to see the share price rising strongly in the near future under these circumstances.
We don't want to rain on the parade too much, but we did also find 5 warning signs for Strax (4 make us uncomfortable!) that you need to be mindful of.
Of course, profitable companies with a history of great earnings growth are generally safer bets. So you may wish to see this free collection of other companies that have reasonable P/E ratios and have grown earnings strongly.
The New Payments ETF Is Live on NASDAQ:
Money is moving to real-time rails, and a newly listed ETF now gives investors direct exposure. Fast settlement. Institutional custody. Simple access.
Explore how this launch could reshape portfolios
Sponsored ContentNew: Manage All Your Stock Portfolios in One Place
We've created the ultimate portfolio companion for stock investors, and it's free.
• Connect an unlimited number of Portfolios and see your total in one currency
• Be alerted to new Warning Signs or Risks via email or mobile
• Track the Fair Value of your stocks
Have feedback on this article? Concerned about the content? Get in touch with us directly. Alternatively, email editorial-team (at) simplywallst.com.
This article by Simply Wall St is general in nature. We provide commentary based on historical data and analyst forecasts only using an unbiased methodology and our articles are not intended to be financial advice. It does not constitute a recommendation to buy or sell any stock, and does not take account of your objectives, or your financial situation. We aim to bring you long-term focused analysis driven by fundamental data. Note that our analysis may not factor in the latest price-sensitive company announcements or qualitative material. Simply Wall St has no position in any stocks mentioned.
About OM:STRAX
Strax
Designs, develops, manufactures, and sells mobile accessories worldwide.
Moderate and slightly overvalued.
Market Insights

Weekly Picks

Early mover in a fast growing industry. Likely to experience share price volatility as they scale


A case for CA$31.80 (undiluted), aka 8,616% upside from CA$0.37 (an 86 bagger!).


Moderation and Stabilisation: HOLD: Fair Price based on a 4-year Cycle is $12.08
Recently Updated Narratives


Title: Market Sentiment Is Dead Wrong — Here's Why PSEC Deserves a Second Look


An amazing opportunity to potentially get a 100 bagger

Amazon: Why the World’s Biggest Platform Still Runs on Invisible Economics
Popular Narratives


Crazy Undervalued 42 Baggers Silver Play (Active & Running Mine)


MicroVision will explode future revenue by 380.37% with a vision towards success


NVDA: Expanding AI Demand Will Drive Major Data Center Investments Through 2026
Trending Discussion
