
Advertisement
- Sweden
- /
- Consumer Durables
- /
- OM:CANDLE B
Candles Scandinavia AB (publ) (STO:CANDLE B) Stocks Pounded By 25% But Not Lagging Industry On Growth Or Pricing
The Candles Scandinavia AB (publ) (STO:CANDLE B) share price has fared very poorly over the last month, falling by a substantial 25%. Still, a bad month hasn't completely ruined the past year with the stock gaining 48%, which is great even in a bull market.
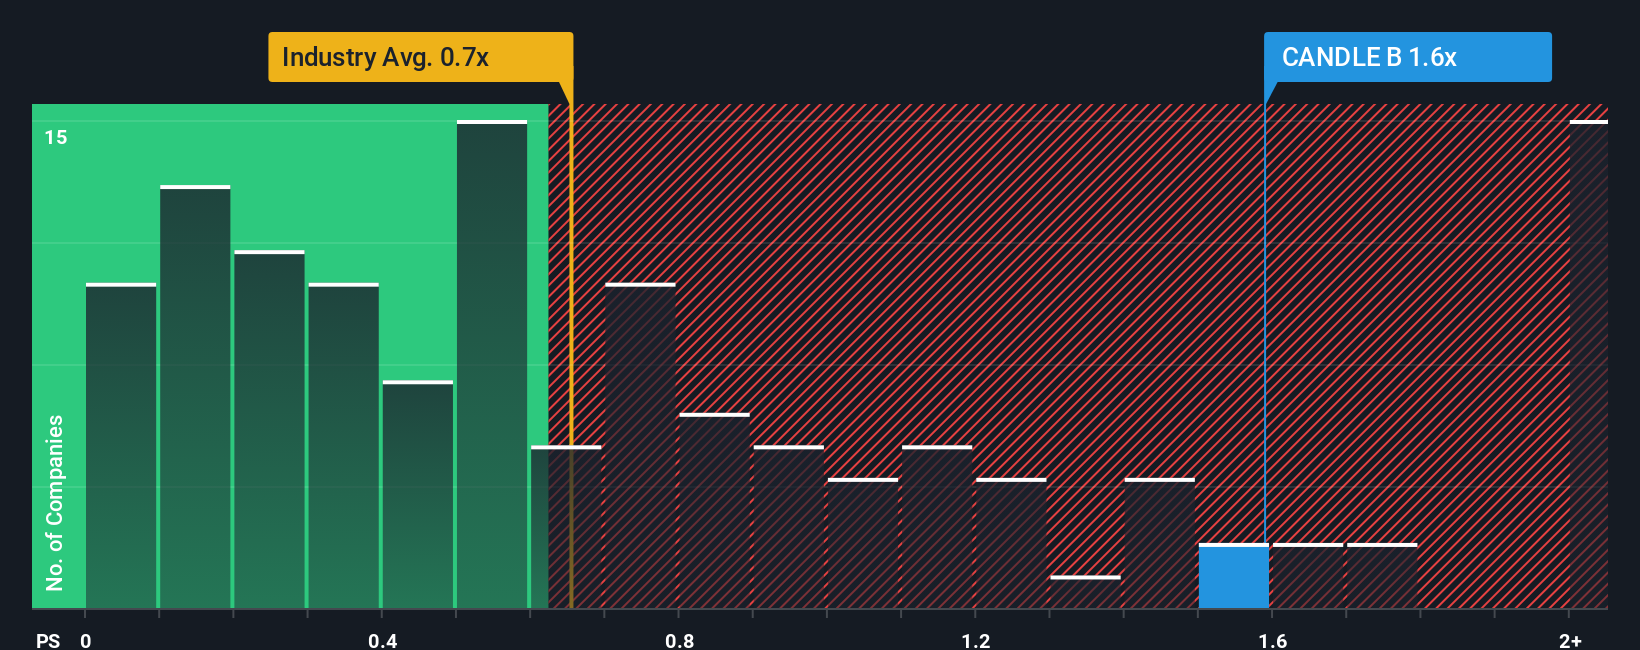
Even after such a large drop in price, you could still be forgiven for thinking Candles Scandinavia is a stock not worth researching with a price-to-sales ratios (or "P/S") of 1.6x, considering almost half the companies in Sweden's Consumer Durables industry have P/S ratios below 0.6x. Although, it's not wise to just take the P/S at face value as there may be an explanation why it's as high as it is.
View our latest analysis for Candles Scandinavia
What Does Candles Scandinavia's P/S Mean For Shareholders?
Recent times have been pleasing for Candles Scandinavia as its revenue has risen in spite of the industry's average revenue going into reverse. It seems that many are expecting the company to continue defying the broader industry adversity, which has increased investors’ willingness to pay up for the stock. You'd really hope so, otherwise you're paying a pretty hefty price for no particular reason.
Keen to find out how analysts think Candles Scandinavia's future stacks up against the industry? In that case, our free report is a great place to start.What Are Revenue Growth Metrics Telling Us About The High P/S?
There's an inherent assumption that a company should outperform the industry for P/S ratios like Candles Scandinavia's to be considered reasonable.
Taking a look back first, we see that the company managed to grow revenues by a handy 9.4% last year. The solid recent performance means it was also able to grow revenue by 12% in total over the last three years. Accordingly, shareholders would have probably been satisfied with the medium-term rates of revenue growth.
Looking ahead now, revenue is anticipated to climb by 51% per annum during the coming three years according to the one analyst following the company. With the industry only predicted to deliver 7.6% per year, the company is positioned for a stronger revenue result.
In light of this, it's understandable that Candles Scandinavia's P/S sits above the majority of other companies. It seems most investors are expecting this strong future growth and are willing to pay more for the stock.
What We Can Learn From Candles Scandinavia's P/S?
There's still some elevation in Candles Scandinavia's P/S, even if the same can't be said for its share price recently. We'd say the price-to-sales ratio's power isn't primarily as a valuation instrument but rather to gauge current investor sentiment and future expectations.
Our look into Candles Scandinavia shows that its P/S ratio remains high on the merit of its strong future revenues. It appears that shareholders are confident in the company's future revenues, which is propping up the P/S. It's hard to see the share price falling strongly in the near future under these circumstances.
There are also other vital risk factors to consider before investing and we've discovered 1 warning sign for Candles Scandinavia that you should be aware of.
If strong companies turning a profit tickle your fancy, then you'll want to check out this free list of interesting companies that trade on a low P/E (but have proven they can grow earnings).
New: AI Stock Screener & Alerts
Our new AI Stock Screener scans the market every day to uncover opportunities.
• Dividend Powerhouses (3%+ Yield)
• Undervalued Small Caps with Insider Buying
• High growth Tech and AI Companies
Or build your own from over 50 metrics.
Have feedback on this article? Concerned about the content? Get in touch with us directly. Alternatively, email editorial-team (at) simplywallst.com.
This article by Simply Wall St is general in nature. We provide commentary based on historical data and analyst forecasts only using an unbiased methodology and our articles are not intended to be financial advice. It does not constitute a recommendation to buy or sell any stock, and does not take account of your objectives, or your financial situation. We aim to bring you long-term focused analysis driven by fundamental data. Note that our analysis may not factor in the latest price-sensitive company announcements or qualitative material. Simply Wall St has no position in any stocks mentioned.
About OM:CANDLE B
Candles Scandinavia
Manufactures and sells scented candles based on plant-based wax made of rapeseed oil.
High growth potential with excellent balance sheet.
Market Insights

Advertisement
Community Narratives
MicroVision will explode future revenue by 380.37% with a vision towards success
Fair Value US$60.00|98.5% undervalued
TH
Community Contributor
The Indispensable Artery for a New North American Economy
Fair Value CA$132.87|2.3% undervalued
TI
Community Contributor