Stock Analysis
Is The Market Rewarding XANO Industri AB (publ) (STO:XANO B) With A Negative Sentiment As A Result Of Its Mixed Fundamentals?


With its stock down 14% over the past month, it is easy to disregard XANO Industri (STO:XANO B). It is possible that the markets have ignored the company's differing financials and decided to lean-in to the negative sentiment. Long-term fundamentals are usually what drive market outcomes, so it's worth paying close attention. Particularly, we will be paying attention to XANO Industri's ROE today.
Return on equity or ROE is a key measure used to assess how efficiently a company's management is utilizing the company's capital. Simply put, it is used to assess the profitability of a company in relation to its equity capital.
See our latest analysis for XANO Industri
How Is ROE Calculated?
Return on equity can be calculated by using the formula:
Return on Equity = Net Profit (from continuing operations) ÷ Shareholders' Equity
So, based on the above formula, the ROE for XANO Industri is:
7.8% = kr131m ÷ kr1.7b (Based on the trailing twelve months to March 2024).
The 'return' is the profit over the last twelve months. So, this means that for every SEK1 of its shareholder's investments, the company generates a profit of SEK0.08.
Why Is ROE Important For Earnings Growth?
So far, we've learned that ROE is a measure of a company's profitability. Based on how much of its profits the company chooses to reinvest or "retain", we are then able to evaluate a company's future ability to generate profits. Assuming all else is equal, companies that have both a higher return on equity and higher profit retention are usually the ones that have a higher growth rate when compared to companies that don't have the same features.
XANO Industri's Earnings Growth And 7.8% ROE
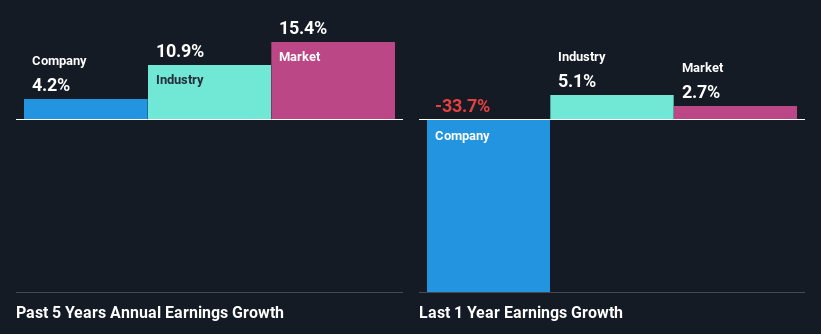
At first glance, XANO Industri's ROE doesn't look very promising. A quick further study shows that the company's ROE doesn't compare favorably to the industry average of 15% either. Thus, the low net income growth of 4.2% seen by XANO Industri over the past five years could probably be the result of the low ROE.
As a next step, we compared XANO Industri's net income growth with the industry and were disappointed to see that the company's growth is lower than the industry average growth of 11% in the same period.
Earnings growth is an important metric to consider when valuing a stock. The investor should try to establish if the expected growth or decline in earnings, whichever the case may be, is priced in. Doing so will help them establish if the stock's future looks promising or ominous. One good indicator of expected earnings growth is the P/E ratio which determines the price the market is willing to pay for a stock based on its earnings prospects. So, you may want to check if XANO Industri is trading on a high P/E or a low P/E, relative to its industry.
Is XANO Industri Making Efficient Use Of Its Profits?
While XANO Industri has a decent three-year median payout ratio of 32% (or a retention ratio of 68%), it has seen very little growth in earnings. So there might be other factors at play here which could potentially be hampering growth. For example, the business has faced some headwinds.
Moreover, XANO Industri has been paying dividends for at least ten years or more suggesting that management must have perceived that the shareholders prefer dividends over earnings growth.
Summary
Overall, we have mixed feelings about XANO Industri. While the company does have a high rate of profit retention, its low rate of return is probably hampering its earnings growth. Wrapping up, we would proceed with caution with this company and one way of doing that would be to look at the risk profile of the business. You can see the 2 risks we have identified for XANO Industri by visiting our risks dashboard for free on our platform here.
Valuation is complex, but we're helping make it simple.
Find out whether XANO Industri is potentially over or undervalued by checking out our comprehensive analysis, which includes fair value estimates, risks and warnings, dividends, insider transactions and financial health.
View the Free AnalysisHave feedback on this article? Concerned about the content? Get in touch with us directly. Alternatively, email editorial-team (at) simplywallst.com.
This article by Simply Wall St is general in nature. We provide commentary based on historical data and analyst forecasts only using an unbiased methodology and our articles are not intended to be financial advice. It does not constitute a recommendation to buy or sell any stock, and does not take account of your objectives, or your financial situation. We aim to bring you long-term focused analysis driven by fundamental data. Note that our analysis may not factor in the latest price-sensitive company announcements or qualitative material. Simply Wall St has no position in any stocks mentioned.
About OM:XANO B
XANO Industri
Manufactures and sells industrial products and automation equipment.
Excellent balance sheet and fair value.
