
Advertisement
These 4 Measures Indicate That Troax Group (STO:TROAX) Is Using Debt Reasonably Well
Warren Buffett famously said, 'Volatility is far from synonymous with risk.' So it seems the smart money knows that debt - which is usually involved in bankruptcies - is a very important factor, when you assess how risky a company is. Importantly, Troax Group AB (publ) (STO:TROAX) does carry debt. But the more important question is: how much risk is that debt creating?
Why Does Debt Bring Risk?
Debt assists a business until the business has trouble paying it off, either with new capital or with free cash flow. In the worst case scenario, a company can go bankrupt if it cannot pay its creditors. However, a more usual (but still expensive) situation is where a company must dilute shareholders at a cheap share price simply to get debt under control. Having said that, the most common situation is where a company manages its debt reasonably well - and to its own advantage. The first step when considering a company's debt levels is to consider its cash and debt together.
View our latest analysis for Troax Group
How Much Debt Does Troax Group Carry?
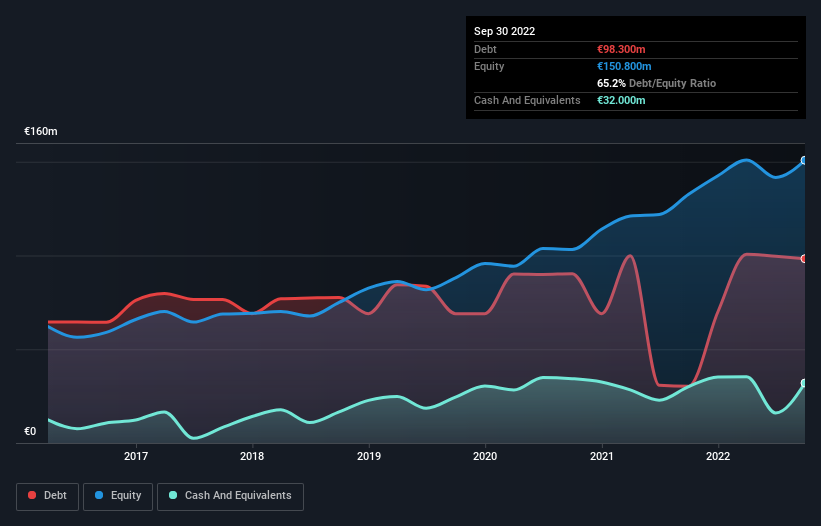
The image below, which you can click on for greater detail, shows that at September 2022 Troax Group had debt of €98.3m, up from €30.3m in one year. However, it also had €32.0m in cash, and so its net debt is €66.3m.
A Look At Troax Group's Liabilities
Zooming in on the latest balance sheet data, we can see that Troax Group had liabilities of €46.8m due within 12 months and liabilities of €98.3m due beyond that. Offsetting these obligations, it had cash of €32.0m as well as receivables valued at €61.2m due within 12 months. So its liabilities total €51.9m more than the combination of its cash and short-term receivables.
Of course, Troax Group has a market capitalization of €1.23b, so these liabilities are probably manageable. But there are sufficient liabilities that we would certainly recommend shareholders continue to monitor the balance sheet, going forward.
We measure a company's debt load relative to its earnings power by looking at its net debt divided by its earnings before interest, tax, depreciation, and amortization (EBITDA) and by calculating how easily its earnings before interest and tax (EBIT) cover its interest expense (interest cover). Thus we consider debt relative to earnings both with and without depreciation and amortization expenses.
Troax Group's net debt is only 1.2 times its EBITDA. And its EBIT covers its interest expense a whopping 52.0 times over. So you could argue it is no more threatened by its debt than an elephant is by a mouse. While Troax Group doesn't seem to have gained much on the EBIT line, at least earnings remain stable for now. There's no doubt that we learn most about debt from the balance sheet. But ultimately the future profitability of the business will decide if Troax Group can strengthen its balance sheet over time. So if you want to see what the professionals think, you might find this free report on analyst profit forecasts to be interesting.
But our final consideration is also important, because a company cannot pay debt with paper profits; it needs cold hard cash. So it's worth checking how much of that EBIT is backed by free cash flow. During the last three years, Troax Group produced sturdy free cash flow equating to 56% of its EBIT, about what we'd expect. This cold hard cash means it can reduce its debt when it wants to.
Our View
Troax Group's interest cover suggests it can handle its debt as easily as Cristiano Ronaldo could score a goal against an under 14's goalkeeper. And we also thought its net debt to EBITDA was a positive. When we consider the range of factors above, it looks like Troax Group is pretty sensible with its use of debt. While that brings some risk, it can also enhance returns for shareholders. The balance sheet is clearly the area to focus on when you are analysing debt. But ultimately, every company can contain risks that exist outside of the balance sheet. For instance, we've identified 2 warning signs for Troax Group that you should be aware of.
If, after all that, you're more interested in a fast growing company with a rock-solid balance sheet, then check out our list of net cash growth stocks without delay.
Valuation is complex, but we're here to simplify it.
Discover if Troax Group might be undervalued or overvalued with our detailed analysis, featuring fair value estimates, potential risks, dividends, insider trades, and its financial condition.
Access Free AnalysisHave feedback on this article? Concerned about the content? Get in touch with us directly. Alternatively, email editorial-team (at) simplywallst.com.
This article by Simply Wall St is general in nature. We provide commentary based on historical data and analyst forecasts only using an unbiased methodology and our articles are not intended to be financial advice. It does not constitute a recommendation to buy or sell any stock, and does not take account of your objectives, or your financial situation. We aim to bring you long-term focused analysis driven by fundamental data. Note that our analysis may not factor in the latest price-sensitive company announcements or qualitative material. Simply Wall St has no position in any stocks mentioned.
About OM:TROAX
Troax Group
Through its subsidiaries, produces and sells mesh panels in the Nordic region, the United Kingdom, North America, Europe, and internationally.
Flawless balance sheet with high growth potential.
Similar Companies
Market Insights

Advertisement
Community Narratives
Finding The True Value Of A Logistics Powerhouse
Fair Value US$95.21|8.6% undervalued
NV
Community Contributor
Paradigm Biopharmaceuticals Will Lead Osteoarthritis Treatment with Zilosul's FDA Success
Fair Value AU$5.50|92.1% undervalued
AM
Community Contributor
Barrick Mining (ABX:CA): A Gold Hedge against a U.S. Shutdown
Fair Value CA$60.00|25.6% undervalued
GM
Community Contributor