- Sweden
- /
- Construction
- /
- OM:SKA B
Investors in Skanska (STO:SKA B) have seen notable returns of 34% over the past year


The simplest way to invest in stocks is to buy exchange traded funds. But investors can boost returns by picking market-beating companies to own shares in. For example, the Skanska AB (publ) (STO:SKA B) share price is up 30% in the last 1 year, clearly besting the market return of around 21% (not including dividends). So that should have shareholders smiling. In contrast, the longer term returns are negative, since the share price is 17% lower than it was three years ago.
Let's take a look at the underlying fundamentals over the longer term, and see if they've been consistent with shareholders returns.
See our latest analysis for Skanska
There is no denying that markets are sometimes efficient, but prices do not always reflect underlying business performance. One imperfect but simple way to consider how the market perception of a company has shifted is to compare the change in the earnings per share (EPS) with the share price movement.
During the last year, Skanska actually saw its earnings per share drop 42%.
This means it's unlikely the market is judging the company based on earnings growth. Therefore, it seems likely that investors are putting more weight on metrics other than EPS, at the moment.
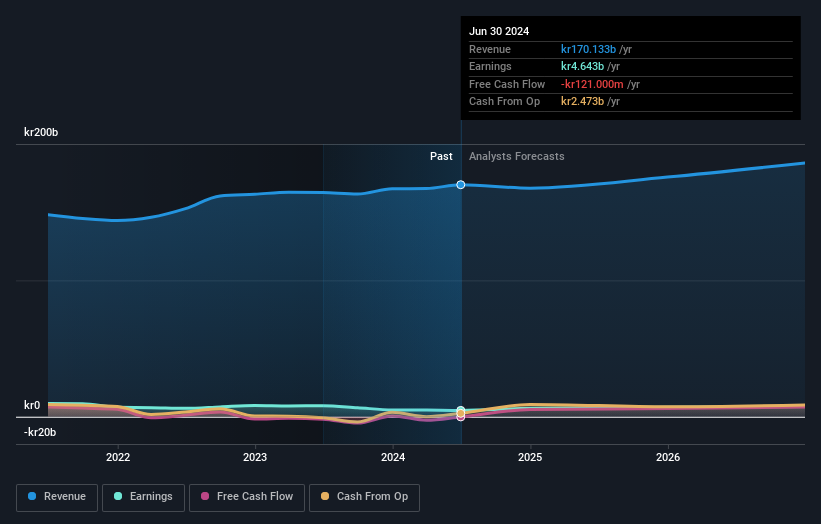
We think that the revenue growth of 3.5% could have some investors interested. We do see some companies suppress earnings in order to accelerate revenue growth.
You can see below how earnings and revenue have changed over time (discover the exact values by clicking on the image).
It's probably worth noting we've seen significant insider buying in the last quarter, which we consider a positive. That said, we think earnings and revenue growth trends are even more important factors to consider. This free report showing analyst forecasts should help you form a view on Skanska
What About Dividends?
When looking at investment returns, it is important to consider the difference between total shareholder return (TSR) and share price return. Whereas the share price return only reflects the change in the share price, the TSR includes the value of dividends (assuming they were reinvested) and the benefit of any discounted capital raising or spin-off. Arguably, the TSR gives a more comprehensive picture of the return generated by a stock. We note that for Skanska the TSR over the last 1 year was 34%, which is better than the share price return mentioned above. And there's no prize for guessing that the dividend payments largely explain the divergence!
A Different Perspective
It's good to see that Skanska has rewarded shareholders with a total shareholder return of 34% in the last twelve months. That's including the dividend. That's better than the annualised return of 5% over half a decade, implying that the company is doing better recently. Given the share price momentum remains strong, it might be worth taking a closer look at the stock, lest you miss an opportunity. It's always interesting to track share price performance over the longer term. But to understand Skanska better, we need to consider many other factors. Case in point: We've spotted 2 warning signs for Skanska you should be aware of.
If you like to buy stocks alongside management, then you might just love this free list of companies. (Hint: most of them are flying under the radar).
Please note, the market returns quoted in this article reflect the market weighted average returns of stocks that currently trade on Swedish exchanges.
New: Manage All Your Stock Portfolios in One Place
We've created the ultimate portfolio companion for stock investors, and it's free.
• Connect an unlimited number of Portfolios and see your total in one currency
• Be alerted to new Warning Signs or Risks via email or mobile
• Track the Fair Value of your stocks
Have feedback on this article? Concerned about the content? Get in touch with us directly. Alternatively, email editorial-team (at) simplywallst.com.
This article by Simply Wall St is general in nature. We provide commentary based on historical data and analyst forecasts only using an unbiased methodology and our articles are not intended to be financial advice. It does not constitute a recommendation to buy or sell any stock, and does not take account of your objectives, or your financial situation. We aim to bring you long-term focused analysis driven by fundamental data. Note that our analysis may not factor in the latest price-sensitive company announcements or qualitative material. Simply Wall St has no position in any stocks mentioned.
About OM:SKA B
Skanska
Operates as a construction and project development company in the Nordic region, Europe, and the United States.
Flawless balance sheet and fair value.

