Advertisement
Nederman (OM:NMAN) Margin Miss Challenges Bullish Narratives Despite Attractive Valuation

Simply Wall St
Reviewed by Simply Wall St
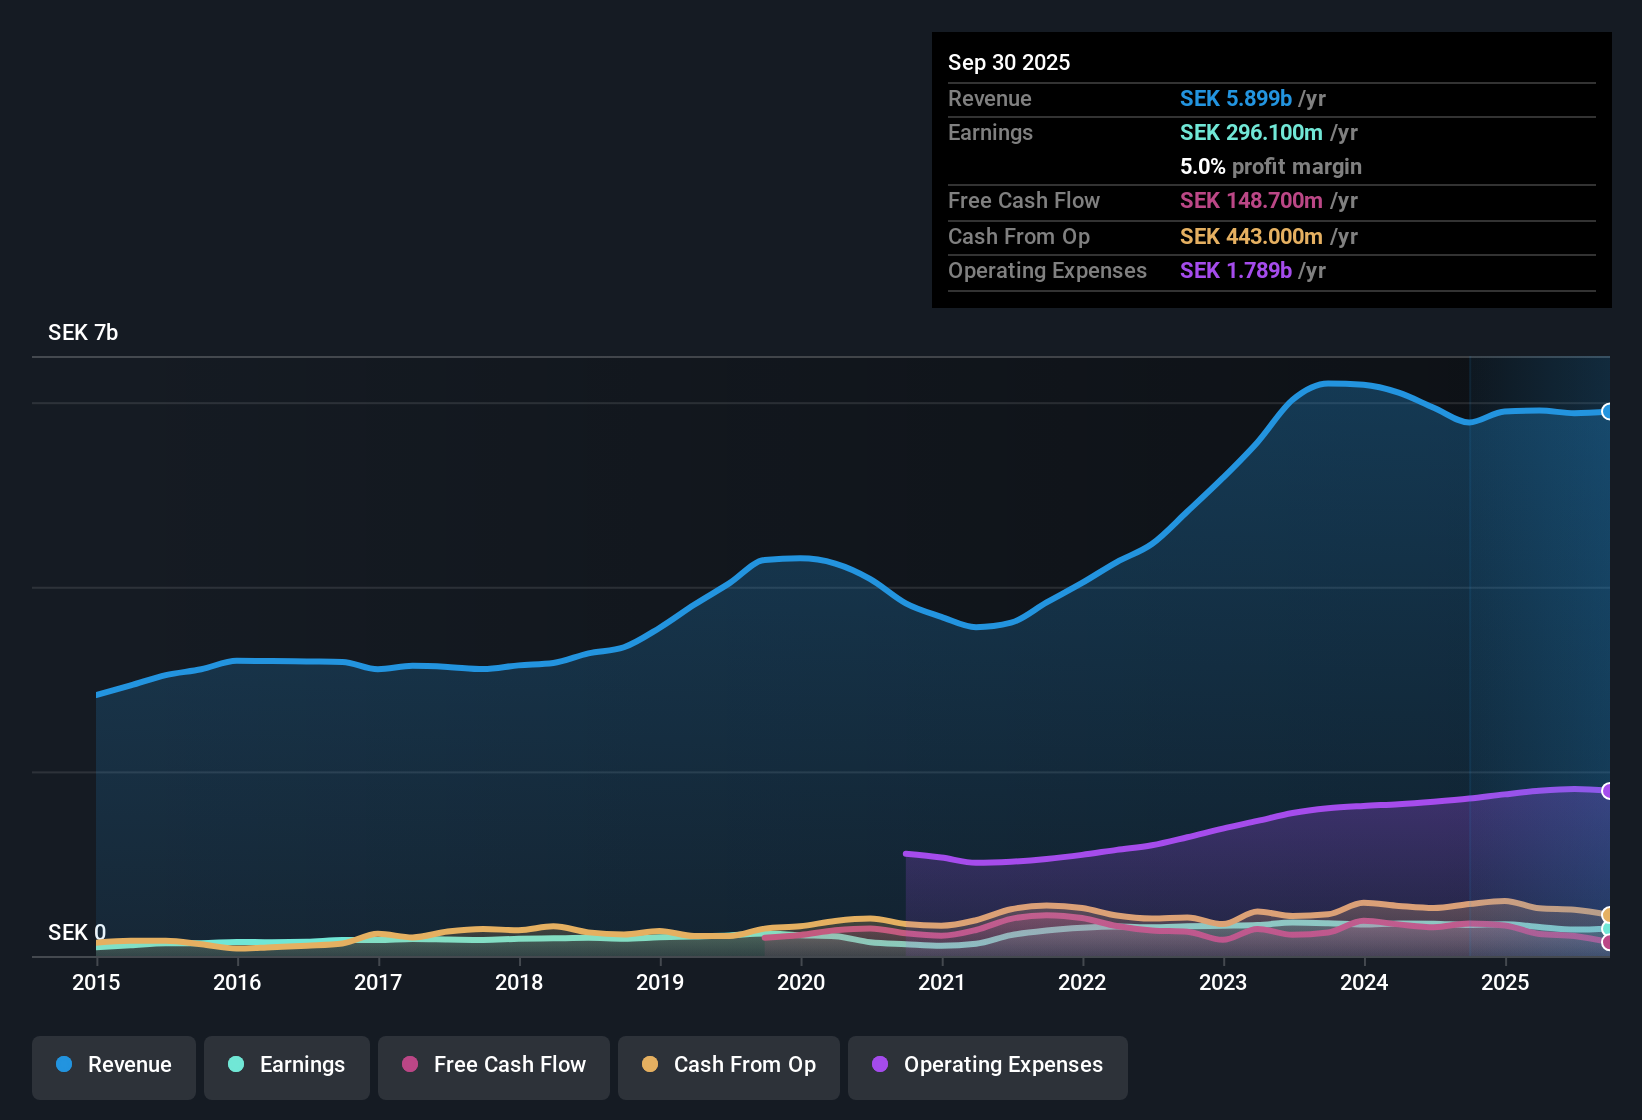
Nederman Holding (OM:NMAN) delivered average annual earnings growth of 13.2% over the past five years, but in the most recent period, net profit margin dipped to 4.9% from last year’s 5.9%. The shares are trading at SEK167, above an estimated fair value of SEK157.46, while the company’s high quality earnings track record is tempered by a year of negative earnings growth. With a Price-To-Earnings ratio of 20.4x, the valuation appears attractive compared with both sector peers and the wider European Building industry. However, investors may be watchful given recent margin pressure and flagged financial risks.
See our full analysis for Nederman Holding.Next, we will put these earnings in context by comparing the results with some of the most widely held investor narratives for Nederman. This will highlight where the numbers support the story and where they may raise new questions.
See what the community is saying about Nederman Holding
Profit Margin Compression Catches Attention
- Nederman's net profit margin slipped to 4.9%, a full percentage point below last year, highlighting renewed cost pressures on the business even as its long-term margin credentials remain intact.
- What is surprising is that despite being recognized for high quality earnings and five-year annual earnings growth averaging 13.2%, the company reported negative earnings growth in the most recent year.
- This shift directly challenges investor confidence in Nederman’s ability to defend margins during industry cycles.
- While historical growth rates may support the case for resilience, shrinking margins could complicate the bullish outlook if not reversed.
Dividend Sustainability Raised as a Risk
- Dividend sustainability and financial positioning were explicitly flagged as risks, even though no major new risk was detailed in the summary.
- Bears argue that pressures on profitability, evidenced by the dip in margin to 4.9%, may eventually force a reappraisal of Nederman’s ability to maintain or grow the dividend.
- Profit margin compression reduces flexibility for shareholder payouts and could heighten scrutiny of the balance sheet.
- Unlike some peers in the European Building industry, Nederman’s flagged risks stand out more for their link to recent results than for any sudden event.
Valuation Remains Attractive Against Peers
- The company’s Price-To-Earnings ratio of 20.4x is below sector (21x) and industry (26.4x) averages, and the shares are trading at SEK167, about 6% above the DCF fair value of SEK157.46.
- The current valuation heavily supports the argument that Nederman still looks reasonable relative to European peers, even with its recent earnings wobble.
- Bulls may be encouraged by Nederman’s ability to sustain a lower P/E against higher sector averages, seeing it as evidence of untapped value.
- The discount to the industry average P/E suggests upside remains if the company stabilizes its margins going forward.
For a breakdown of how Nederman stacks up on value, growth, and risk, read the full consensus narrative before making your next move. 📊 Read the full Nederman Holding Consensus Narrative.
Next Steps
To see how these results tie into long-term growth, risks, and valuation, check out the full range of community narratives for Nederman Holding on Simply Wall St. Add the company to your watchlist or portfolio so you'll be alerted when the story evolves.
Have a different take on the figures? Share your angle and shape your own narrative in just a few minutes: Do it your way
A great starting point for your Nederman Holding research is our analysis highlighting 1 key reward and 2 important warning signs that could impact your investment decision.
See What Else Is Out There
Despite a long-term track record of growth, Nederman now faces pressure on profit margins and has flagged risks around its ability to maintain dividend payouts.
If dividend consistency is your priority, check out these 1984 dividend stocks with yields > 3% to find companies offering reliable yields and a track record of sustainable shareholder returns.
This article by Simply Wall St is general in nature. We provide commentary based on historical data and analyst forecasts only using an unbiased methodology and our articles are not intended to be financial advice. It does not constitute a recommendation to buy or sell any stock, and does not take account of your objectives, or your financial situation. We aim to bring you long-term focused analysis driven by fundamental data. Note that our analysis may not factor in the latest price-sensitive company announcements or qualitative material. Simply Wall St has no position in any stocks mentioned.
Valuation is complex, but we're here to simplify it.
Discover if Nederman Holding might be undervalued or overvalued with our detailed analysis, featuring fair value estimates, potential risks, dividends, insider trades, and its financial condition.
Access Free AnalysisHave feedback on this article? Concerned about the content? Get in touch with us directly. Alternatively, email editorial-team@simplywallst.com
About OM:NMAN
Excellent balance sheet average dividend payer.
Market Insights

Advertisement
Community Narratives
Finding The True Value Of A Logistics Powerhouse
Fair Value US$95.21|8.6% undervalued
NV
Community Contributor
Paradigm Biopharmaceuticals Will Lead Osteoarthritis Treatment with Zilosul's FDA Success
Fair Value AU$5.50|92.1% undervalued
AM
Community Contributor
Barrick Mining (ABX:CA): A Gold Hedge against a U.S. Shutdown
Fair Value CA$60.00|25.6% undervalued
GM
Community Contributor