Further Upside For Lyckegård Group AB (publ) (STO:LYGRD) Shares Could Introduce Price Risks After 26% Bounce
Despite an already strong run, Lyckegård Group AB (publ) (STO:LYGRD) shares have been powering on, with a gain of 26% in the last thirty days. The annual gain comes to 144% following the latest surge, making investors sit up and take notice.
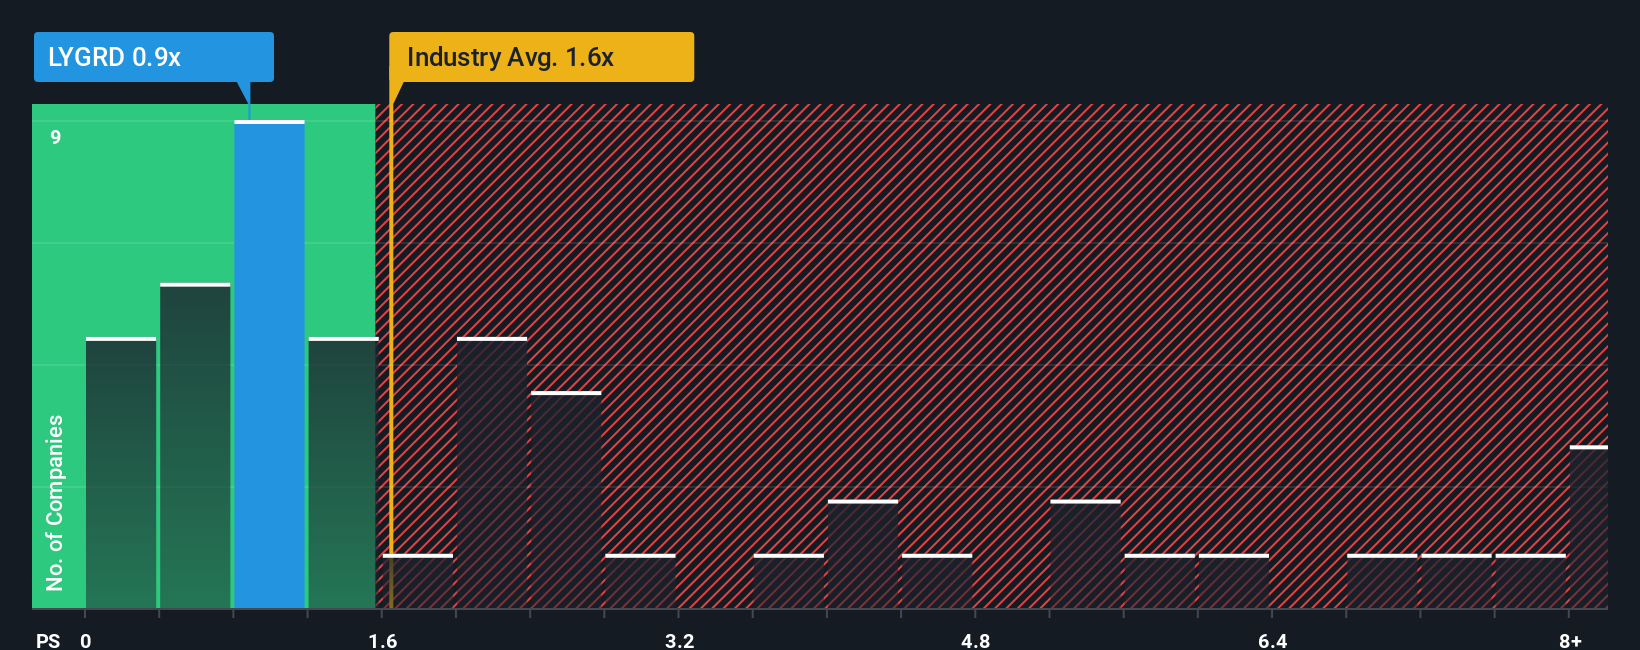
Although its price has surged higher, Lyckegård Group may still be sending bullish signals at the moment with its price-to-sales (or "P/S") ratio of 0.9x, since almost half of all companies in the Machinery industry in Sweden have P/S ratios greater than 1.6x and even P/S higher than 4x are not unusual. However, the P/S might be low for a reason and it requires further investigation to determine if it's justified.
See our latest analysis for Lyckegård Group

How Lyckegård Group Has Been Performing
For instance, Lyckegård Group's receding revenue in recent times would have to be some food for thought. One possibility is that the P/S is low because investors think the company won't do enough to avoid underperforming the broader industry in the near future. Those who are bullish on Lyckegård Group will be hoping that this isn't the case so that they can pick up the stock at a lower valuation.
Although there are no analyst estimates available for Lyckegård Group, take a look at this free data-rich visualisation to see how the company stacks up on earnings, revenue and cash flow.How Is Lyckegård Group's Revenue Growth Trending?
In order to justify its P/S ratio, Lyckegård Group would need to produce sluggish growth that's trailing the industry.
Retrospectively, the last year delivered a frustrating 3.6% decrease to the company's top line. Spectacularly, three year revenue growth has ballooned by several orders of magnitude, despite the drawbacks experienced in the last 12 months. Therefore, it's fair to say the revenue growth recently has been superb for the company, but investors will want to ask why it is now in decline.
Comparing that recent medium-term revenue trajectory with the industry's one-year growth forecast of 1.7% shows it's noticeably more attractive.
With this in mind, we find it intriguing that Lyckegård Group's P/S isn't as high compared to that of its industry peers. Apparently some shareholders believe the recent performance has exceeded its limits and have been accepting significantly lower selling prices.
The Final Word
Lyckegård Group's stock price has surged recently, but its but its P/S still remains modest. Typically, we'd caution against reading too much into price-to-sales ratios when settling on investment decisions, though it can reveal plenty about what other market participants think about the company.
We're very surprised to see Lyckegård Group currently trading on a much lower than expected P/S since its recent three-year growth is higher than the wider industry forecast. When we see strong revenue with faster-than-industry growth, we assume there are some significant underlying risks to the company's ability to make money which is applying downwards pressure on the P/S ratio. While recent revenue trends over the past medium-term suggest that the risk of a price decline is low, investors appear to perceive a likelihood of revenue fluctuations in the future.
We don't want to rain on the parade too much, but we did also find 4 warning signs for Lyckegård Group (2 make us uncomfortable!) that you need to be mindful of.
If these risks are making you reconsider your opinion on Lyckegård Group, explore our interactive list of high quality stocks to get an idea of what else is out there.
New: AI Stock Screener & Alerts
Our new AI Stock Screener scans the market every day to uncover opportunities.
• Dividend Powerhouses (3%+ Yield)
• Undervalued Small Caps with Insider Buying
• High growth Tech and AI Companies
Or build your own from over 50 metrics.
Have feedback on this article? Concerned about the content? Get in touch with us directly. Alternatively, email editorial-team (at) simplywallst.com.
This article by Simply Wall St is general in nature. We provide commentary based on historical data and analyst forecasts only using an unbiased methodology and our articles are not intended to be financial advice. It does not constitute a recommendation to buy or sell any stock, and does not take account of your objectives, or your financial situation. We aim to bring you long-term focused analysis driven by fundamental data. Note that our analysis may not factor in the latest price-sensitive company announcements or qualitative material. Simply Wall St has no position in any stocks mentioned.
About OM:LYGRD
Lyckegård Group
Offers products and services for sustainable irrigation and outdoor environments in Sweden and Norway.
Moderate risk with adequate balance sheet.
Market Insights
Community Narratives


