Stock Analysis


Today we'll do a simple run through of a valuation method used to estimate the attractiveness of Garo Aktiebolag (publ) (STO:GARO) as an investment opportunity by estimating the company's future cash flows and discounting them to their present value. One way to achieve this is by employing the Discounted Cash Flow (DCF) model. Models like these may appear beyond the comprehension of a lay person, but they're fairly easy to follow.
We generally believe that a company's value is the present value of all of the cash it will generate in the future. However, a DCF is just one valuation metric among many, and it is not without flaws. For those who are keen learners of equity analysis, the Simply Wall St analysis model here may be something of interest to you.
View our latest analysis for Garo Aktiebolag
The method
We're using the 2-stage growth model, which simply means we take in account two stages of company's growth. In the initial period the company may have a higher growth rate and the second stage is usually assumed to have a stable growth rate. To start off with, we need to estimate the next ten years of cash flows. Where possible we use analyst estimates, but when these aren't available we extrapolate the previous free cash flow (FCF) from the last estimate or reported value. We assume companies with shrinking free cash flow will slow their rate of shrinkage, and that companies with growing free cash flow will see their growth rate slow, over this period. We do this to reflect that growth tends to slow more in the early years than it does in later years.
Generally we assume that a dollar today is more valuable than a dollar in the future, and so the sum of these future cash flows is then discounted to today's value:
10-year free cash flow (FCF) estimate
| 2023 | 2024 | 2025 | 2026 | 2027 | 2028 | 2029 | 2030 | 2031 | 2032 | |
| Levered FCF (SEK, Millions) | kr101.0m | kr200.0m | kr239.0m | kr271.8m | kr298.2m | kr318.9m | kr334.7m | kr346.6m | kr355.7m | kr362.5m |
| Growth Rate Estimate Source | Analyst x1 | Analyst x1 | Est @ 19.48% | Est @ 13.74% | Est @ 9.73% | Est @ 6.92% | Est @ 4.95% | Est @ 3.57% | Est @ 2.61% | Est @ 1.93% |
| Present Value (SEK, Millions) Discounted @ 5.1% | kr96.1 | kr181 | kr206 | kr222 | kr232 | kr236 | kr236 | kr232 | kr226 | kr219 |
("Est" = FCF growth rate estimated by Simply Wall St)
Present Value of 10-year Cash Flow (PVCF) = kr2.1b
The second stage is also known as Terminal Value, this is the business's cash flow after the first stage. For a number of reasons a very conservative growth rate is used that cannot exceed that of a country's GDP growth. In this case we have used the 5-year average of the 10-year government bond yield (0.4%) to estimate future growth. In the same way as with the 10-year 'growth' period, we discount future cash flows to today's value, using a cost of equity of 5.1%.
Terminal Value (TV)= FCF2032 × (1 + g) ÷ (r – g) = kr363m× (1 + 0.4%) ÷ (5.1%– 0.4%) = kr7.6b
Present Value of Terminal Value (PVTV)= TV / (1 + r)10= kr7.6b÷ ( 1 + 5.1%)10= kr4.6b
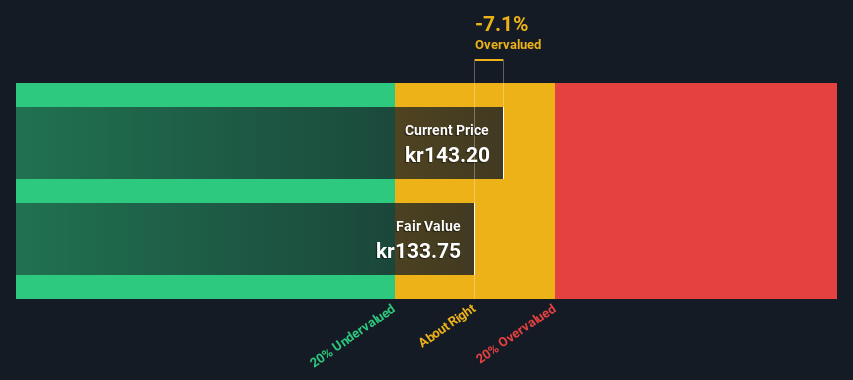
The total value is the sum of cash flows for the next ten years plus the discounted terminal value, which results in the Total Equity Value, which in this case is kr6.7b. To get the intrinsic value per share, we divide this by the total number of shares outstanding. Compared to the current share price of kr143, the company appears around fair value at the time of writing. Remember though, that this is just an approximate valuation, and like any complex formula - garbage in, garbage out.
The assumptions
The calculation above is very dependent on two assumptions. The first is the discount rate and the other is the cash flows. Part of investing is coming up with your own evaluation of a company's future performance, so try the calculation yourself and check your own assumptions. The DCF also does not consider the possible cyclicality of an industry, or a company's future capital requirements, so it does not give a full picture of a company's potential performance. Given that we are looking at Garo Aktiebolag as potential shareholders, the cost of equity is used as the discount rate, rather than the cost of capital (or weighted average cost of capital, WACC) which accounts for debt. In this calculation we've used 5.1%, which is based on a levered beta of 1.129. Beta is a measure of a stock's volatility, compared to the market as a whole. We get our beta from the industry average beta of globally comparable companies, with an imposed limit between 0.8 and 2.0, which is a reasonable range for a stable business.
Next Steps:
Although the valuation of a company is important, it ideally won't be the sole piece of analysis you scrutinize for a company. The DCF model is not a perfect stock valuation tool. Rather it should be seen as a guide to "what assumptions need to be true for this stock to be under/overvalued?" For instance, if the terminal value growth rate is adjusted slightly, it can dramatically alter the overall result. For Garo Aktiebolag, we've put together three essential items you should explore:
- Risks: For example, we've discovered 1 warning sign for Garo Aktiebolag that you should be aware of before investing here.
- Future Earnings: How does GARO's growth rate compare to its peers and the wider market? Dig deeper into the analyst consensus number for the upcoming years by interacting with our free analyst growth expectation chart.
- Other Solid Businesses: Low debt, high returns on equity and good past performance are fundamental to a strong business. Why not explore our interactive list of stocks with solid business fundamentals to see if there are other companies you may not have considered!
PS. Simply Wall St updates its DCF calculation for every Swedish stock every day, so if you want to find the intrinsic value of any other stock just search here.
Valuation is complex, but we're helping make it simple.
Find out whether Garo Aktiebolag is potentially over or undervalued by checking out our comprehensive analysis, which includes fair value estimates, risks and warnings, dividends, insider transactions and financial health.
View the Free AnalysisHave feedback on this article? Concerned about the content? Get in touch with us directly. Alternatively, email editorial-team (at) simplywallst.com.
This article by Simply Wall St is general in nature. We provide commentary based on historical data and analyst forecasts only using an unbiased methodology and our articles are not intended to be financial advice. It does not constitute a recommendation to buy or sell any stock, and does not take account of your objectives, or your financial situation. We aim to bring you long-term focused analysis driven by fundamental data. Note that our analysis may not factor in the latest price-sensitive company announcements or qualitative material. Simply Wall St has no position in any stocks mentioned.
About OM:GARO
Garo Aktiebolag
Develops, manufactures, and markets electrical installation materials in Sweden, Norway, Finland, Ireland, the United Kingdom, Poland, and Germany.
Undervalued with reasonable growth potential.
