Is FM Mattsson Mora Group AB (publ)'s (STO:FMM B) Stock's Recent Performance Being Led By Its Attractive Financial Prospects?


FM Mattsson Mora Group's (STO:FMM B) stock is up by a considerable 12% over the past three months. Given the company's impressive performance, we decided to study its financial indicators more closely as a company's financial health over the long-term usually dictates market outcomes. In this article, we decided to focus on FM Mattsson Mora Group's ROE.
Return on Equity or ROE is a test of how effectively a company is growing its value and managing investors’ money. In short, ROE shows the profit each dollar generates with respect to its shareholder investments.
Check out our latest analysis for FM Mattsson Mora Group
How Do You Calculate Return On Equity?
The formula for ROE is:
Return on Equity = Net Profit (from continuing operations) ÷ Shareholders' Equity
So, based on the above formula, the ROE for FM Mattsson Mora Group is:
16% = kr165m ÷ kr1.1b (Based on the trailing twelve months to September 2023).
The 'return' is the profit over the last twelve months. One way to conceptualize this is that for each SEK1 of shareholders' capital it has, the company made SEK0.16 in profit.
What Is The Relationship Between ROE And Earnings Growth?
We have already established that ROE serves as an efficient profit-generating gauge for a company's future earnings. We now need to evaluate how much profit the company reinvests or "retains" for future growth which then gives us an idea about the growth potential of the company. Assuming everything else remains unchanged, the higher the ROE and profit retention, the higher the growth rate of a company compared to companies that don't necessarily bear these characteristics.
FM Mattsson Mora Group's Earnings Growth And 16% ROE
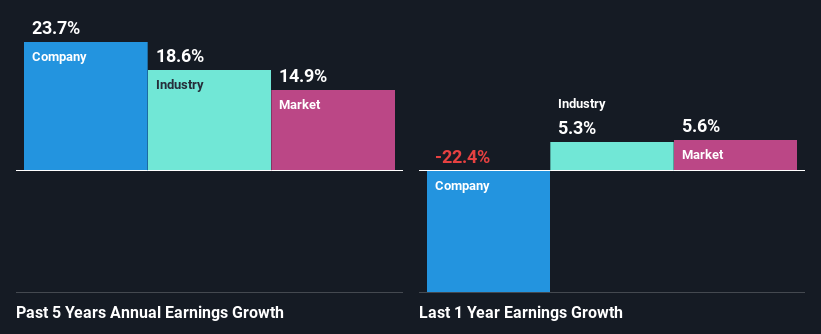
To start with, FM Mattsson Mora Group's ROE looks acceptable. Even when compared to the industry average of 14% the company's ROE looks quite decent. This certainly adds some context to FM Mattsson Mora Group's exceptional 24% net income growth seen over the past five years. However, there could also be other drivers behind this growth. For example, it is possible that the company's management has made some good strategic decisions, or that the company has a low payout ratio.
We then compared FM Mattsson Mora Group's net income growth with the industry and we're pleased to see that the company's growth figure is higher when compared with the industry which has a growth rate of 19% in the same 5-year period.
Earnings growth is an important metric to consider when valuing a stock. What investors need to determine next is if the expected earnings growth, or the lack of it, is already built into the share price. By doing so, they will have an idea if the stock is headed into clear blue waters or if swampy waters await. If you're wondering about FM Mattsson Mora Group's's valuation, check out this gauge of its price-to-earnings ratio, as compared to its industry.
Is FM Mattsson Mora Group Efficiently Re-investing Its Profits?
FM Mattsson Mora Group has a significant three-year median payout ratio of 55%, meaning the company only retains 45% of its income. This implies that the company has been able to achieve high earnings growth despite returning most of its profits to shareholders.
Besides, FM Mattsson Mora Group has been paying dividends over a period of six years. This shows that the company is committed to sharing profits with its shareholders.
Conclusion
On the whole, we feel that FM Mattsson Mora Group's performance has been quite good. Especially the high ROE, Which has contributed to the impressive growth seen in earnings. Despite the company reinvesting only a small portion of its profits, it still has managed to grow its earnings so that is appreciable. So far, we've only made a quick discussion around the company's earnings growth. You can do your own research on FM Mattsson Mora Group and see how it has performed in the past by looking at this FREE detailed graph of past earnings, revenue and cash flows.
New: AI Stock Screener & Alerts
Our new AI Stock Screener scans the market every day to uncover opportunities.
• Dividend Powerhouses (3%+ Yield)
• Undervalued Small Caps with Insider Buying
• High growth Tech and AI Companies
Or build your own from over 50 metrics.
Have feedback on this article? Concerned about the content? Get in touch with us directly. Alternatively, email editorial-team (at) simplywallst.com.
This article by Simply Wall St is general in nature. We provide commentary based on historical data and analyst forecasts only using an unbiased methodology and our articles are not intended to be financial advice. It does not constitute a recommendation to buy or sell any stock, and does not take account of your objectives, or your financial situation. We aim to bring you long-term focused analysis driven by fundamental data. Note that our analysis may not factor in the latest price-sensitive company announcements or qualitative material. Simply Wall St has no position in any stocks mentioned.
About OM:FMM B
FM Mattsson
Engages in the development, manufacture, and sale of water taps and related products for bathrooms and kitchens in Sweden, Norway, Denmark, Finland, Benelux, the United Kingdom, Germany, and Italy.
Flawless balance sheet, good value and pays a dividend.
