Stock Analysis
- Sweden
- /
- Electrical
- /
- OM:FAG
Is Fagerhult Group AB's (STO:FAG) Recent Price Movement Underpinned By Its Weak Fundamentals?


It is hard to get excited after looking at Fagerhult Group's (STO:FAG) recent performance, when its stock has declined 8.2% over the past three months. It is possible that the markets have ignored the company's differing financials and decided to lean-in to the negative sentiment. Stock prices are usually driven by a company’s financial performance over the long term, and therefore we decided to pay more attention to the company's financial performance. Specifically, we decided to study Fagerhult Group's ROE in this article.
ROE or return on equity is a useful tool to assess how effectively a company can generate returns on the investment it received from its shareholders. In other words, it is a profitability ratio which measures the rate of return on the capital provided by the company's shareholders.
Check out our latest analysis for Fagerhult Group
How Do You Calculate Return On Equity?
The formula for ROE is:
Return on Equity = Net Profit (from continuing operations) ÷ Shareholders' Equity
So, based on the above formula, the ROE for Fagerhult Group is:
7.0% = kr524m ÷ kr7.5b (Based on the trailing twelve months to March 2024).
The 'return' refers to a company's earnings over the last year. That means that for every SEK1 worth of shareholders' equity, the company generated SEK0.07 in profit.
What Has ROE Got To Do With Earnings Growth?
We have already established that ROE serves as an efficient profit-generating gauge for a company's future earnings. Depending on how much of these profits the company reinvests or "retains", and how effectively it does so, we are then able to assess a company’s earnings growth potential. Generally speaking, other things being equal, firms with a high return on equity and profit retention, have a higher growth rate than firms that don’t share these attributes.
Fagerhult Group's Earnings Growth And 7.0% ROE
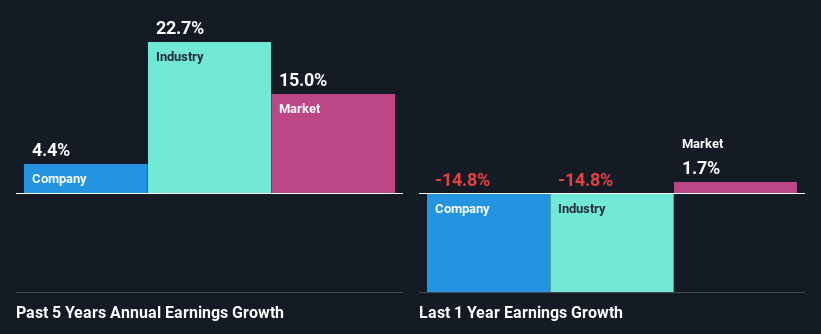
At first glance, Fagerhult Group's ROE doesn't look very promising. We then compared the company's ROE to the broader industry and were disappointed to see that the ROE is lower than the industry average of 16%. Thus, the low net income growth of 4.4% seen by Fagerhult Group over the past five years could probably be the result of the low ROE.
As a next step, we compared Fagerhult Group's net income growth with the industry and were disappointed to see that the company's growth is lower than the industry average growth of 23% in the same period.
Earnings growth is a huge factor in stock valuation. What investors need to determine next is if the expected earnings growth, or the lack of it, is already built into the share price. By doing so, they will have an idea if the stock is headed into clear blue waters or if swampy waters await. Is Fagerhult Group fairly valued compared to other companies? These 3 valuation measures might help you decide.
Is Fagerhult Group Using Its Retained Earnings Effectively?
While Fagerhult Group has a decent three-year median payout ratio of 47% (or a retention ratio of 53%), it has seen very little growth in earnings. So there might be other factors at play here which could potentially be hampering growth. For example, the business has faced some headwinds.
In addition, Fagerhult Group has been paying dividends over a period of at least ten years suggesting that keeping up dividend payments is way more important to the management even if it comes at the cost of business growth.
Conclusion
On the whole, we feel that the performance shown by Fagerhult Group can be open to many interpretations. While the company does have a high rate of profit retention, its low rate of return is probably hampering its earnings growth. Wrapping up, we would proceed with caution with this company and one way of doing that would be to look at the risk profile of the business. You can see the 1 risk we have identified for Fagerhult Group by visiting our risks dashboard for free on our platform here.
Valuation is complex, but we're helping make it simple.
Find out whether Fagerhult Group is potentially over or undervalued by checking out our comprehensive analysis, which includes fair value estimates, risks and warnings, dividends, insider transactions and financial health.
View the Free AnalysisHave feedback on this article? Concerned about the content? Get in touch with us directly. Alternatively, email editorial-team (at) simplywallst.com.
This article by Simply Wall St is general in nature. We provide commentary based on historical data and analyst forecasts only using an unbiased methodology and our articles are not intended to be financial advice. It does not constitute a recommendation to buy or sell any stock, and does not take account of your objectives, or your financial situation. We aim to bring you long-term focused analysis driven by fundamental data. Note that our analysis may not factor in the latest price-sensitive company announcements or qualitative material. Simply Wall St has no position in any stocks mentioned.
Valuation is complex, but we're helping make it simple.
Find out whether Fagerhult Group is potentially over or undervalued by checking out our comprehensive analysis, which includes fair value estimates, risks and warnings, dividends, insider transactions and financial health.
View the Free AnalysisHave feedback on this article? Concerned about the content? Get in touch with us directly. Alternatively, email editorial-team@simplywallst.com
About OM:FAG
Fagerhult Group
Engages in the manufacture and sale of professional lighting solutions worldwide.
Flawless balance sheet average dividend payer.
