Epiroc AB (publ) (STO:EPI A) Stock Has Shown Weakness Lately But Financials Look Strong: Should Prospective Shareholders Make The Leap?


Epiroc (STO:EPI A) has had a rough three months with its share price down 12%. But if you pay close attention, you might gather that its strong financials could mean that the stock could potentially see an increase in value in the long-term, given how markets usually reward companies with good financial health. Particularly, we will be paying attention to Epiroc's ROE today.
Return on equity or ROE is a key measure used to assess how efficiently a company's management is utilizing the company's capital. Simply put, it is used to assess the profitability of a company in relation to its equity capital.
Check out our latest analysis for Epiroc
How Do You Calculate Return On Equity?
The formula for ROE is:
Return on Equity = Net Profit (from continuing operations) ÷ Shareholders' Equity
So, based on the above formula, the ROE for Epiroc is:
26% = kr9.6b ÷ kr37b (Based on the trailing twelve months to September 2023).
The 'return' is the profit over the last twelve months. So, this means that for every SEK1 of its shareholder's investments, the company generates a profit of SEK0.26.
What Has ROE Got To Do With Earnings Growth?
Thus far, we have learned that ROE measures how efficiently a company is generating its profits. We now need to evaluate how much profit the company reinvests or "retains" for future growth which then gives us an idea about the growth potential of the company. Assuming all else is equal, companies that have both a higher return on equity and higher profit retention are usually the ones that have a higher growth rate when compared to companies that don't have the same features.
Epiroc's Earnings Growth And 26% ROE
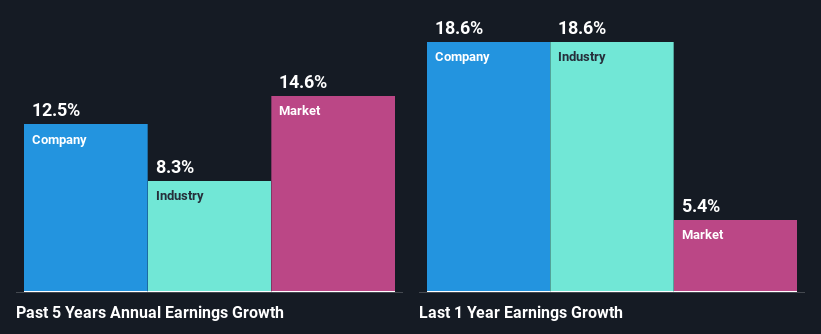
Firstly, we acknowledge that Epiroc has a significantly high ROE. Secondly, even when compared to the industry average of 16% the company's ROE is quite impressive. This likely paved the way for the modest 12% net income growth seen by Epiroc over the past five years.
Next, on comparing with the industry net income growth, we found that Epiroc's growth is quite high when compared to the industry average growth of 8.3% in the same period, which is great to see.
Earnings growth is a huge factor in stock valuation. It’s important for an investor to know whether the market has priced in the company's expected earnings growth (or decline). Doing so will help them establish if the stock's future looks promising or ominous. One good indicator of expected earnings growth is the P/E ratio which determines the price the market is willing to pay for a stock based on its earnings prospects. So, you may want to check if Epiroc is trading on a high P/E or a low P/E, relative to its industry.
Is Epiroc Efficiently Re-investing Its Profits?
With a three-year median payout ratio of 47% (implying that the company retains 53% of its profits), it seems that Epiroc is reinvesting efficiently in a way that it sees respectable amount growth in its earnings and pays a dividend that's well covered.
Besides, Epiroc has been paying dividends over a period of five years. This shows that the company is committed to sharing profits with its shareholders. Our latest analyst data shows that the future payout ratio of the company over the next three years is expected to be approximately 49%. Accordingly, forecasts suggest that Epiroc's future ROE will be 22% which is again, similar to the current ROE.
Conclusion
Overall, we are quite pleased with Epiroc's performance. In particular, it's great to see that the company is investing heavily into its business and along with a high rate of return, that has resulted in a sizeable growth in its earnings. That being so, a study of the latest analyst forecasts show that the company is expected to see a slowdown in its future earnings growth. To know more about the latest analysts predictions for the company, check out this visualization of analyst forecasts for the company.
Valuation is complex, but we're here to simplify it.
Discover if Epiroc might be undervalued or overvalued with our detailed analysis, featuring fair value estimates, potential risks, dividends, insider trades, and its financial condition.
Access Free AnalysisHave feedback on this article? Concerned about the content? Get in touch with us directly. Alternatively, email editorial-team (at) simplywallst.com.
This article by Simply Wall St is general in nature. We provide commentary based on historical data and analyst forecasts only using an unbiased methodology and our articles are not intended to be financial advice. It does not constitute a recommendation to buy or sell any stock, and does not take account of your objectives, or your financial situation. We aim to bring you long-term focused analysis driven by fundamental data. Note that our analysis may not factor in the latest price-sensitive company announcements or qualitative material. Simply Wall St has no position in any stocks mentioned.
About OM:EPI A
Epiroc
Develops and produces equipment for use in surface and underground applications in North America, Europe, South America, Europe, Africa, the Middle East, Asia, and Australia.
Good value with adequate balance sheet.
