
Advertisement
- Saudi Arabia
- /
- IT
- /
- SASE:7204
Perfect Presentation for Commercial Services' (TADAWUL:7204) Sluggish Earnings Might Be Just The Beginning Of Its Problems
A lackluster earnings announcement from Perfect Presentation for Commercial Services Company (TADAWUL:7204) last week didn't sink the stock price. However, we believe that investors should be aware of some underlying factors which may be of concern.
A Closer Look At Perfect Presentation for Commercial Services' Earnings
In high finance, the key ratio used to measure how well a company converts reported profits into free cash flow (FCF) is the accrual ratio (from cashflow). In plain english, this ratio subtracts FCF from net profit, and divides that number by the company's average operating assets over that period. This ratio tells us how much of a company's profit is not backed by free cashflow.
That means a negative accrual ratio is a good thing, because it shows that the company is bringing in more free cash flow than its profit would suggest. While having an accrual ratio above zero is of little concern, we do think it's worth noting when a company has a relatively high accrual ratio. That's because some academic studies have suggested that high accruals ratios tend to lead to lower profit or less profit growth.
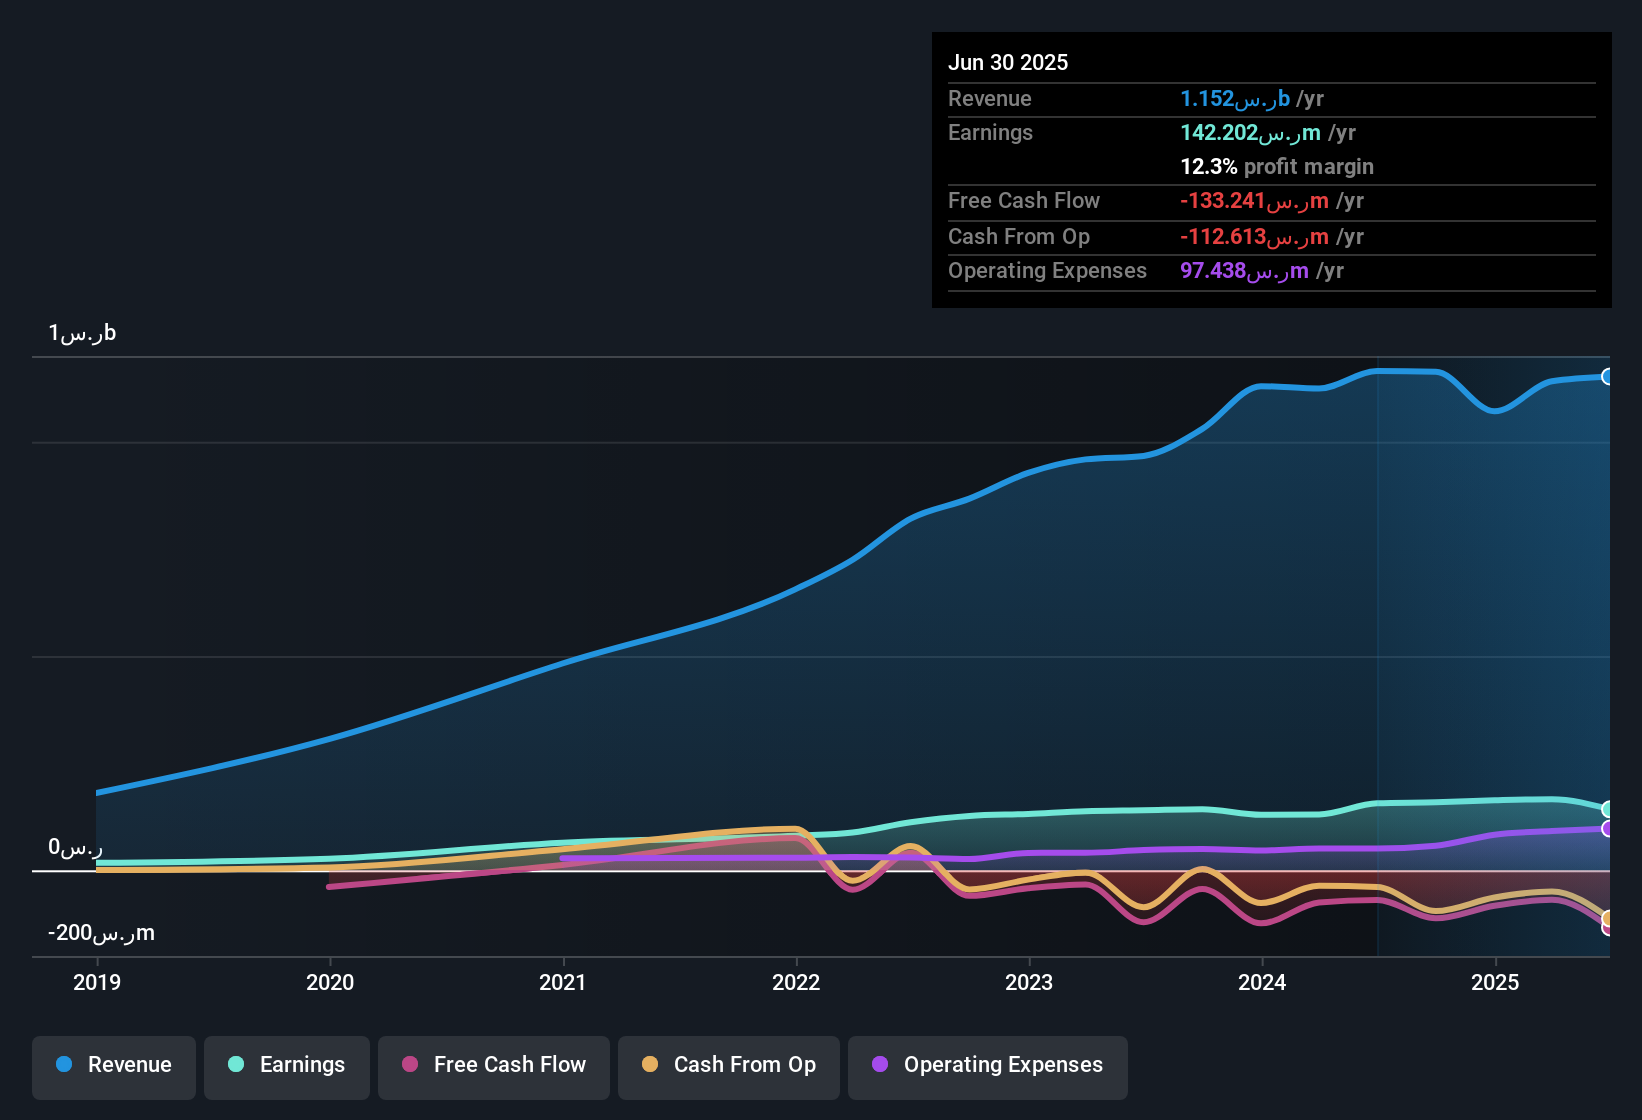
Perfect Presentation for Commercial Services has an accrual ratio of 0.28 for the year to June 2025. Therefore, we know that it's free cashflow was significantly lower than its statutory profit, raising questions about how useful that profit figure really is. Even though it reported a profit of ر.س142.2m, a look at free cash flow indicates it actually burnt through ر.س133m in the last year. Coming off the back of negative free cash flow last year, we imagine some shareholders might wonder if its cash burn of ر.س133m, this year, indicates high risk.
That might leave you wondering what analysts are forecasting in terms of future profitability. Luckily, you can click here to see an interactive graph depicting future profitability, based on their estimates.
Our Take On Perfect Presentation for Commercial Services' Profit Performance
Perfect Presentation for Commercial Services didn't convert much of its profit to free cash flow in the last year, which some investors may consider rather suboptimal. Therefore, it seems possible to us that Perfect Presentation for Commercial Services' true underlying earnings power is actually less than its statutory profit. But at least holders can take some solace from the 27% per annum growth in EPS for the last three. Of course, we've only just scratched the surface when it comes to analysing its earnings; one could also consider margins, forecast growth, and return on investment, among other factors. If you'd like to know more about Perfect Presentation for Commercial Services as a business, it's important to be aware of any risks it's facing. For example, we've discovered 2 warning signs that you should run your eye over to get a better picture of Perfect Presentation for Commercial Services.
This note has only looked at a single factor that sheds light on the nature of Perfect Presentation for Commercial Services' profit. But there is always more to discover if you are capable of focussing your mind on minutiae. Some people consider a high return on equity to be a good sign of a quality business. So you may wish to see this free collection of companies boasting high return on equity, or this list of stocks with high insider ownership.
New: Manage All Your Stock Portfolios in One Place
We've created the ultimate portfolio companion for stock investors, and it's free.
• Connect an unlimited number of Portfolios and see your total in one currency
• Be alerted to new Warning Signs or Risks via email or mobile
• Track the Fair Value of your stocks
Have feedback on this article? Concerned about the content? Get in touch with us directly. Alternatively, email editorial-team (at) simplywallst.com.
This article by Simply Wall St is general in nature. We provide commentary based on historical data and analyst forecasts only using an unbiased methodology and our articles are not intended to be financial advice. It does not constitute a recommendation to buy or sell any stock, and does not take account of your objectives, or your financial situation. We aim to bring you long-term focused analysis driven by fundamental data. Note that our analysis may not factor in the latest price-sensitive company announcements or qualitative material. Simply Wall St has no position in any stocks mentioned.
About SASE:7204
Perfect Presentation for Commercial Services
Operates as an ICT services and technology solutions company in the Kingdom of Saudi Arabia.
Reasonable growth potential with mediocre balance sheet.
Market Insights

Advertisement
Community Narratives
MicroVision will explode future revenue by 380.37% with a vision towards success
Fair Value US$60|98.4% undervalued
TH
Community Contributor
The Indispensable Artery for a New North American Economy
Fair Value CA$132.87|0.6% undervalued
TI
Community Contributor
Recently Updated Narratives
BL


BlackGoat on Alphabet ·
Alphabet: The Under-appreciated Compounder Hiding in Plain Sight
Fair Value:US$324.481.3% undervalued
75 followersusers have followed this narrative
3 commentsusers have commented on this narrative
1 likeusers have liked this narrative
BE


Bejgal on MINISO Group Holding ·
MINISO's fair value is projected at 26.69 with an anticipated PE ratio shift of 20x
Fair Value:US$26.6926.7% undervalued
44 followersusers have followed this narrative
3 commentsusers have commented on this narrative
0 likesusers have liked this narrative
TI


TickerTickle on Oracle ·
The Quiet Giant That Became AI’s Power Grid
Fair Value:US$389.8147.4% undervalued
9 followersusers have followed this narrative
1 commentusers have commented on this narrative
0 likesusers have liked this narrative
Popular Narratives
OS

oscargarcia on Alphabet ·
The company that turned a verb into a global necessity and basically runs the modern internet, digital ads, smartphones, maps, and AI.
Fair Value:US$3405.9% undervalued
136 followersusers have followed this narrative
6 commentsusers have commented on this narrative
18 likesusers have liked this narrative
TH

TheWallstreetKing on MicroVision ·
MicroVision will explode future revenue by 380.37% with a vision towards success
Fair Value:US$6098.4% undervalued
89 followersusers have followed this narrative
11 commentsusers have commented on this narrative
18 likesusers have liked this narrative
AN


AnalystConsensusTarget on NVIDIA ·
NVDA: Expanding AI Demand Will Drive Major Data Center Investments Through 2026
Fair Value:US$232.7922.6% undervalued
926 followersusers have followed this narrative
6 commentsusers have commented on this narrative
22 likesusers have liked this narrative