
Advertisement
- Romania
- /
- Electric Utilities
- /
- BVB:SNN
S.N. Nuclearelectrica (BVB:SNN) Has Rewarded Shareholders With An Exceptional 773% Total Return On Their Investment
For many, the main point of investing in the stock market is to achieve spectacular returns. While the best companies are hard to find, but they can generate massive returns over long periods. Don't believe it? Then look at the S.N. Nuclearelectrica S.A. (BVB:SNN) share price. It's 346% higher than it was five years ago. This just goes to show the value creation that some businesses can achieve. It's also good to see the share price up 45% over the last quarter.
See our latest analysis for S.N. Nuclearelectrica
There is no denying that markets are sometimes efficient, but prices do not always reflect underlying business performance. One way to examine how market sentiment has changed over time is to look at the interaction between a company's share price and its earnings per share (EPS).
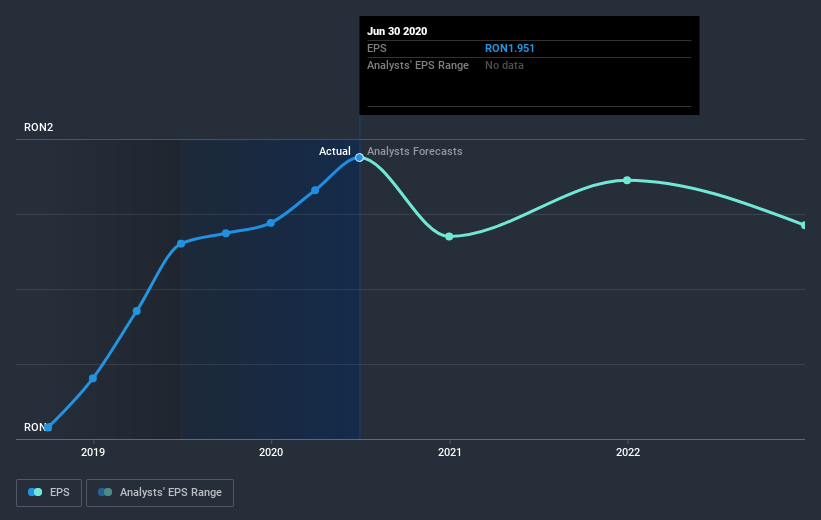
During five years of share price growth, S.N. Nuclearelectrica achieved compound earnings per share (EPS) growth of 37% per year. That makes the EPS growth particularly close to the yearly share price growth of 35%. That suggests that the market sentiment around the company hasn't changed much over that time. In fact, the share price seems to largely reflect the EPS growth.
The company's earnings per share (over time) is depicted in the image below (click to see the exact numbers).
It is of course excellent to see how S.N. Nuclearelectrica has grown profits over the years, but the future is more important for shareholders. If you are thinking of buying or selling S.N. Nuclearelectrica stock, you should check out this FREE detailed report on its balance sheet.
What About Dividends?
It is important to consider the total shareholder return, as well as the share price return, for any given stock. The TSR is a return calculation that accounts for the value of cash dividends (assuming that any dividend received was reinvested) and the calculated value of any discounted capital raisings and spin-offs. So for companies that pay a generous dividend, the TSR is often a lot higher than the share price return. We note that for S.N. Nuclearelectrica the TSR over the last 5 years was 773%, which is better than the share price return mentioned above. This is largely a result of its dividend payments!
A Different Perspective
It's good to see that S.N. Nuclearelectrica has rewarded shareholders with a total shareholder return of 131% in the last twelve months. And that does include the dividend. Since the one-year TSR is better than the five-year TSR (the latter coming in at 54% per year), it would seem that the stock's performance has improved in recent times. In the best case scenario, this may hint at some real business momentum, implying that now could be a great time to delve deeper. It's always interesting to track share price performance over the longer term. But to understand S.N. Nuclearelectrica better, we need to consider many other factors. For example, we've discovered 3 warning signs for S.N. Nuclearelectrica (1 is a bit unpleasant!) that you should be aware of before investing here.
But note: S.N. Nuclearelectrica may not be the best stock to buy. So take a peek at this free list of interesting companies with past earnings growth (and further growth forecast).
Please note, the market returns quoted in this article reflect the market weighted average returns of stocks that currently trade on RO exchanges.
When trading S.N. Nuclearelectrica or any other investment, use the platform considered by many to be the Professional's Gateway to the Worlds Market, Interactive Brokers. You get the lowest-cost* trading on stocks, options, futures, forex, bonds and funds worldwide from a single integrated account. Promoted
New: Manage All Your Stock Portfolios in One Place
We've created the ultimate portfolio companion for stock investors, and it's free.
• Connect an unlimited number of Portfolios and see your total in one currency
• Be alerted to new Warning Signs or Risks via email or mobile
• Track the Fair Value of your stocks
This article by Simply Wall St is general in nature. It does not constitute a recommendation to buy or sell any stock, and does not take account of your objectives, or your financial situation. We aim to bring you long-term focused analysis driven by fundamental data. Note that our analysis may not factor in the latest price-sensitive company announcements or qualitative material. Simply Wall St has no position in any stocks mentioned.
*Interactive Brokers Rated Lowest Cost Broker by StockBrokers.com Annual Online Review 2020
Have feedback on this article? Concerned about the content? Get in touch with us directly. Alternatively, email editorial-team (at) simplywallst.com.
About BVB:SNN
S.N. Nuclearelectrica
Engages in the production and transmission of electricity and thermal energy in Romania.
Flawless balance sheet with proven track record.
Similar Companies
Market Insights

Advertisement
Community Narratives
MicroVision will explode future revenue by 380.37% with a vision towards success
Fair Value US$60|98.4% undervalued
TH
Community Contributor
The Indispensable Artery for a New North American Economy
Fair Value CA$132.87|0.7% overvalued
TI
Community Contributor
Recently Updated Narratives
CE

cementafriend on Constellation Energy ·
Constellation Energy Dividends and Growth
Fair Value:US$348.054.7% overvalued
2 followersusers have followed this narrative
0 commentsusers have commented on this narrative
0 likesusers have liked this narrative
KH

Khagani on CoreWeave ·
CoreWeave's Revenue Expected to Rocket 77.88% in 5-Year Forecast
Fair Value:US$11033.5% undervalued
3 followersusers have followed this narrative
0 commentsusers have commented on this narrative
0 likesusers have liked this narrative
PO

PortfolioPlus on Bisalloy Steel Group ·
Bisalloy Steel Group will shine with a projected profit margin increase of 12.8%
Fair Value:AU$6.7118.0% undervalued
3 followersusers have followed this narrative
0 commentsusers have commented on this narrative
0 likesusers have liked this narrative
Popular Narratives
TH

TheWallstreetKing on MicroVision ·
MicroVision will explode future revenue by 380.37% with a vision towards success
Fair Value:US$6098.4% undervalued
106 followersusers have followed this narrative
10 commentsusers have commented on this narrative
21 likesusers have liked this narrative
AN


AnalystConsensusTarget on NVIDIA ·
NVDA: Expanding AI Demand Will Drive Major Data Center Investments Through 2026
Fair Value:US$250.3929.3% undervalued
936 followersusers have followed this narrative
6 commentsusers have commented on this narrative
24 likesusers have liked this narrative
OS


oscargarcia on Alphabet ·
The company that turned a verb into a global necessity and basically runs the modern internet, digital ads, smartphones, maps, and AI.
Fair Value:US$3405.8% undervalued
144 followersusers have followed this narrative
6 commentsusers have commented on this narrative
18 likesusers have liked this narrative