- Romania
- /
- Real Estate
- /
- BVB:MEOY
S.C. Mecanica Codlea S.A. (BVB:MEOY) Stock Rockets 54% But Many Are Still Ignoring The Company

S.C. Mecanica Codlea S.A. (BVB:MEOY) shareholders have had their patience rewarded with a 54% share price jump in the last month. While recent buyers may be laughing, long-term holders might not be as pleased since the recent gain only brings the stock back to where it started a year ago.
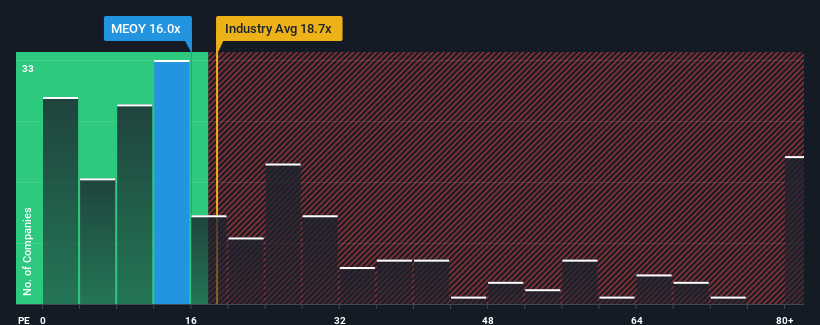
In spite of the firm bounce in price, it's still not a stretch to say that S.C. Mecanica Codlea's price-to-earnings (or "P/E") ratio of 16x right now seems quite "middle-of-the-road" compared to the market in Romania, where the median P/E ratio is around 15x. Although, it's not wise to simply ignore the P/E without explanation as investors may be disregarding a distinct opportunity or a costly mistake.
Recent times have been quite advantageous for S.C. Mecanica Codlea as its earnings have been rising very briskly. The P/E is probably moderate because investors think this strong earnings growth might not be enough to outperform the broader market in the near future. If you like the company, you'd be hoping this isn't the case so that you could potentially pick up some stock while it's not quite in favour.
See our latest analysis for S.C. Mecanica Codlea
How Is S.C. Mecanica Codlea's Growth Trending?
S.C. Mecanica Codlea's P/E ratio would be typical for a company that's only expected to deliver moderate growth, and importantly, perform in line with the market.
Retrospectively, the last year delivered an exceptional 69% gain to the company's bottom line. The strong recent performance means it was also able to grow EPS by 32% in total over the last three years. Therefore, it's fair to say the earnings growth recently has been superb for the company.
Weighing the recent medium-term upward earnings trajectory against the broader market's one-year forecast for contraction of 7.1% shows it's a great look while it lasts.
With this information, we find it odd that S.C. Mecanica Codlea is trading at a fairly similar P/E to the market. It looks like most investors are not convinced the company can maintain its recent positive growth rate in the face of a shrinking broader market.
The Final Word
Its shares have lifted substantially and now S.C. Mecanica Codlea's P/E is also back up to the market median. Using the price-to-earnings ratio alone to determine if you should sell your stock isn't sensible, however it can be a practical guide to the company's future prospects.
We've established that S.C. Mecanica Codlea currently trades on a lower than expected P/E since its recent three-year earnings growth is beating forecasts for a struggling market. When we see its superior earnings with some actual growth, we assume potential risks are what might be placing pressure on the P/E ratio. Perhaps there is some hesitation about the company's ability to stay its recent course and swim against the current of the broader market turmoil. At least the risk of a price drop looks to be subdued, but investors seem to think future earnings could see some volatility.
Having said that, be aware S.C. Mecanica Codlea is showing 4 warning signs in our investment analysis, and 3 of those are significant.
If these risks are making you reconsider your opinion on S.C. Mecanica Codlea, explore our interactive list of high quality stocks to get an idea of what else is out there.
Mobile Infrastructure for Defense and Disaster
The next wave in robotics isn't humanoid. Its fully autonomous towers delivering 5G, ISR, and radar in under 30 minutes, anywhere.
Get the investor briefing before the next round of contracts
Sponsored On Behalf of CiTechNew: Manage All Your Stock Portfolios in One Place
We've created the ultimate portfolio companion for stock investors, and it's free.
• Connect an unlimited number of Portfolios and see your total in one currency
• Be alerted to new Warning Signs or Risks via email or mobile
• Track the Fair Value of your stocks
Have feedback on this article? Concerned about the content? Get in touch with us directly. Alternatively, email editorial-team (at) simplywallst.com.
This article by Simply Wall St is general in nature. We provide commentary based on historical data and analyst forecasts only using an unbiased methodology and our articles are not intended to be financial advice. It does not constitute a recommendation to buy or sell any stock, and does not take account of your objectives, or your financial situation. We aim to bring you long-term focused analysis driven by fundamental data. Note that our analysis may not factor in the latest price-sensitive company announcements or qualitative material. Simply Wall St has no position in any stocks mentioned.
About BVB:MEOY
S.C. Mecanica Codlea
Engages in the rental and sub-lease of real estate properties.
Flawless balance sheet with medium-low risk.
Market Insights

Weekly Picks

Early mover in a fast growing industry. Likely to experience share price volatility as they scale


A case for CA$31.80 (undiluted), aka 8,616% upside from CA$0.37 (an 86 bagger!).


Moderation and Stabilisation: HOLD: Fair Price based on a 4-year Cycle is $12.08
Recently Updated Narratives

Airbnb Stock: Platform Growth in a World of Saturation and Scrutiny

Adobe Stock: AI-Fueled ARR Growth Pushes Guidance Higher, But Cost Pressures Loom

Thomson Reuters Stock: When Legal Intelligence Becomes Mission-Critical Infrastructure
Popular Narratives


Crazy Undervalued 42 Baggers Silver Play (Active & Running Mine)


NVDA: Expanding AI Demand Will Drive Major Data Center Investments Through 2026

The AI Infrastructure Giant Grows Into Its Valuation
Trending Discussion

