Stock Analysis
- Romania
- /
- Real Estate
- /
- BVB:IMP
Impact Developer & Contractor (BVB:IMP) delivers shareholders stellar 24% CAGR over 5 years, surging 10% in the last week alone


Impact Developer & Contractor S.A. (BVB:IMP) shareholders might be concerned after seeing the share price drop 20% in the last quarter. But in stark contrast, the returns over the last half decade have impressed. Indeed, the share price is up an impressive 175% in that time. So while it's never fun to see a share price fall, it's important to look at a longer time horizon. Only time will tell if there is still too much optimism currently reflected in the share price. While the long term returns are impressive, we do have some sympathy for those who bought more recently, given the 32% drop, in the last year.
Since the stock has added RON64m to its market cap in the past week alone, let's see if underlying performance has been driving long-term returns.
Check out our latest analysis for Impact Developer & Contractor
SWOT Analysis for Impact Developer & Contractor
- Debt is well covered by earnings.
- Earnings declined over the past year.
- IMP's financial characteristics indicate limited near-term opportunities for shareholders.
- Lack of analyst coverage makes it difficult to determine IMP's earnings prospects.
- Debt is not well covered by operating cash flow.
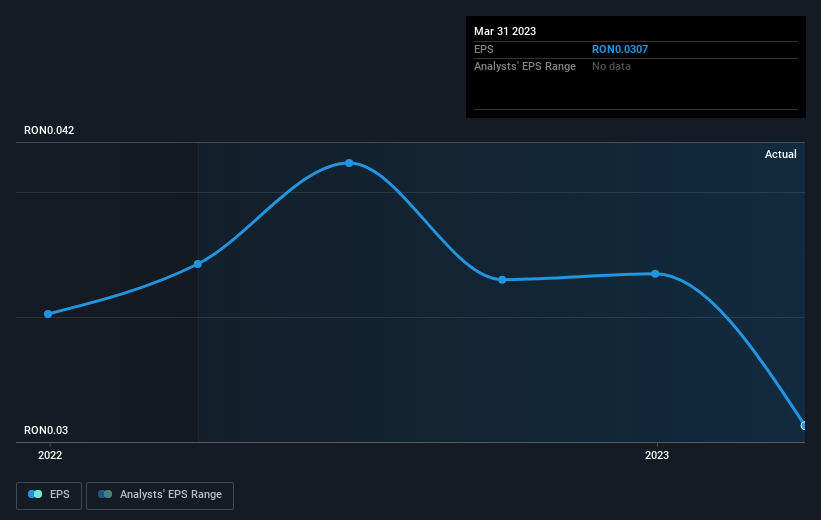
While markets are a powerful pricing mechanism, share prices reflect investor sentiment, not just underlying business performance. One way to examine how market sentiment has changed over time is to look at the interaction between a company's share price and its earnings per share (EPS).
During the last half decade, Impact Developer & Contractor became profitable. Sometimes, the start of profitability is a major inflection point that can signal fast earnings growth to come, which in turn justifies very strong share price gains.
You can see how EPS has changed over time in the image below (click on the chart to see the exact values).
Dive deeper into Impact Developer & Contractor's key metrics by checking this interactive graph of Impact Developer & Contractor's earnings, revenue and cash flow.
A Dividend Lost
The share price return figures discussed above don't include the value of dividends paid previously, but the total shareholder return (TSR) does. In some ways, TSR is a better measure of how well an investment has performed. Over the last 5 years, Impact Developer & Contractor generated a TSR of 191%, which is, of course, better than the share price return. Even though the company isn't paying dividends at the moment, it has done in the past.
A Different Perspective
Investors in Impact Developer & Contractor had a tough year, with a total loss of 32%, against a market gain of about 12%. However, keep in mind that even the best stocks will sometimes underperform the market over a twelve month period. On the bright side, long term shareholders have made money, with a gain of 24% per year over half a decade. It could be that the recent sell-off is an opportunity, so it may be worth checking the fundamental data for signs of a long term growth trend. While it is well worth considering the different impacts that market conditions can have on the share price, there are other factors that are even more important. For example, we've discovered 3 warning signs for Impact Developer & Contractor (1 is significant!) that you should be aware of before investing here.
We will like Impact Developer & Contractor better if we see some big insider buys. While we wait, check out this free list of growing companies with considerable, recent, insider buying.
Please note, the market returns quoted in this article reflect the market weighted average returns of stocks that currently trade on Romanian exchanges.
Valuation is complex, but we're helping make it simple.
Find out whether Impact Developer & Contractor is potentially over or undervalued by checking out our comprehensive analysis, which includes fair value estimates, risks and warnings, dividends, insider transactions and financial health.
View the Free AnalysisHave feedback on this article? Concerned about the content? Get in touch with us directly. Alternatively, email editorial-team (at) simplywallst.com.
This article by Simply Wall St is general in nature. We provide commentary based on historical data and analyst forecasts only using an unbiased methodology and our articles are not intended to be financial advice. It does not constitute a recommendation to buy or sell any stock, and does not take account of your objectives, or your financial situation. We aim to bring you long-term focused analysis driven by fundamental data. Note that our analysis may not factor in the latest price-sensitive company announcements or qualitative material. Simply Wall St has no position in any stocks mentioned.
About BVB:IMP
Impact Developer & Contractor
Operates as a real estate developer in Romania.
Adequate balance sheet and fair value.
