
Advertisement
- Romania
- /
- Metals and Mining
- /
- BVB:SIDG
It's Down 30% But S.C. ArcelorMittal Hunedoara S.A. (BVB:SIDG) Could Be Riskier Than It Looks
S.C. ArcelorMittal Hunedoara S.A. (BVB:SIDG) shareholders won't be pleased to see that the share price has had a very rough month, dropping 30% and undoing the prior period's positive performance. To make matters worse, the recent drop has wiped out a year's worth of gains with the share price now back where it started a year ago.
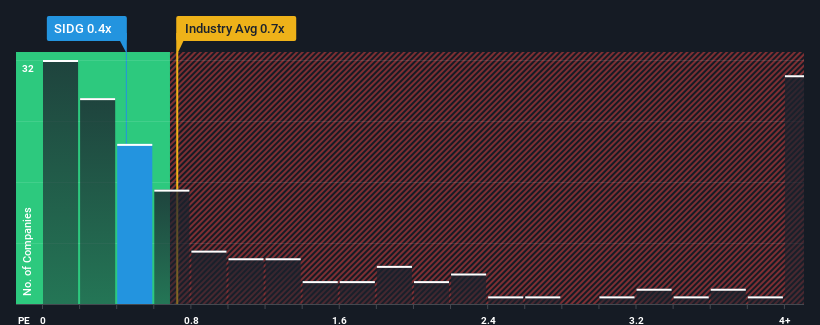
In spite of the heavy fall in price, you could still be forgiven for feeling indifferent about S.C. ArcelorMittal Hunedoara's P/S ratio of 0.4x, since the median price-to-sales (or "P/S") ratio for the Metals and Mining industry in Romania is also close to 0.5x. However, investors might be overlooking a clear opportunity or potential setback if there is no rational basis for the P/S.
View our latest analysis for S.C. ArcelorMittal Hunedoara
How Has S.C. ArcelorMittal Hunedoara Performed Recently?
The recent revenue growth at S.C. ArcelorMittal Hunedoara would have to be considered satisfactory if not spectacular. Perhaps the expectation moving forward is that the revenue growth will track in line with the wider industry for the near term, which has kept the P/S subdued. If not, then at least existing shareholders probably aren't too pessimistic about the future direction of the share price.
We don't have analyst forecasts, but you can see how recent trends are setting up the company for the future by checking out our free report on S.C. ArcelorMittal Hunedoara's earnings, revenue and cash flow.How Is S.C. ArcelorMittal Hunedoara's Revenue Growth Trending?
There's an inherent assumption that a company should be matching the industry for P/S ratios like S.C. ArcelorMittal Hunedoara's to be considered reasonable.
If we review the last year of revenue growth, the company posted a worthy increase of 3.1%. Pleasingly, revenue has also lifted 57% in aggregate from three years ago, partly thanks to the last 12 months of growth. So we can start by confirming that the company has done a great job of growing revenues over that time.
Comparing that to the industry, which is only predicted to deliver 2.6% growth in the next 12 months, the company's momentum is stronger based on recent medium-term annualised revenue results.
With this information, we find it interesting that S.C. ArcelorMittal Hunedoara is trading at a fairly similar P/S compared to the industry. It may be that most investors are not convinced the company can maintain its recent growth rates.
The Bottom Line On S.C. ArcelorMittal Hunedoara's P/S
Following S.C. ArcelorMittal Hunedoara's share price tumble, its P/S is just clinging on to the industry median P/S. Typically, we'd caution against reading too much into price-to-sales ratios when settling on investment decisions, though it can reveal plenty about what other market participants think about the company.
To our surprise, S.C. ArcelorMittal Hunedoara revealed its three-year revenue trends aren't contributing to its P/S as much as we would have predicted, given they look better than current industry expectations. It'd be fair to assume that potential risks the company faces could be the contributing factor to the lower than expected P/S. While recent revenue trends over the past medium-term suggest that the risk of a price decline is low, investors appear to see the likelihood of revenue fluctuations in the future.
Plus, you should also learn about these 3 warning signs we've spotted with S.C. ArcelorMittal Hunedoara (including 2 which are a bit concerning).
If companies with solid past earnings growth is up your alley, you may wish to see this free collection of other companies with strong earnings growth and low P/E ratios.
New: Manage All Your Stock Portfolios in One Place
We've created the ultimate portfolio companion for stock investors, and it's free.
• Connect an unlimited number of Portfolios and see your total in one currency
• Be alerted to new Warning Signs or Risks via email or mobile
• Track the Fair Value of your stocks
Have feedback on this article? Concerned about the content? Get in touch with us directly. Alternatively, email editorial-team (at) simplywallst.com.
This article by Simply Wall St is general in nature. We provide commentary based on historical data and analyst forecasts only using an unbiased methodology and our articles are not intended to be financial advice. It does not constitute a recommendation to buy or sell any stock, and does not take account of your objectives, or your financial situation. We aim to bring you long-term focused analysis driven by fundamental data. Note that our analysis may not factor in the latest price-sensitive company announcements or qualitative material. Simply Wall St has no position in any stocks mentioned.
Have feedback on this article? Concerned about the content? Get in touch with us directly. Alternatively, email editorial-team@simplywallst.com
About BVB:SIDG
S.C. ArcelorMittal Hunedoara
Engages in the production of ferrous metals in primary and ferrous alloy forms in Romania.
Imperfect balance sheet with very low risk.
Market Insights

Advertisement
Community Narratives
MINISO's fair value is projected at 26.69 with an anticipated PE ratio shift of 20x
Fair Value US$24.03|9.0% undervalued
BE
Community Contributor
Procter & Gamble: A Dividend Giant Facing Slowing Growth
Fair Value US$119.81|23.5% overvalued
AN
Community Contributor
Eli Lilly's Future Growth Driven by Tirzepatide and Favorable Market Conditions
Fair Value US$1.19k|14.4% undervalued
EA
Community Contributor