
Advertisement
- Romania
- /
- Medical Equipment
- /
- BVB:IORB
A Piece Of The Puzzle Missing From S.C. IOR S.A.'s (BVB:IORB) Share Price

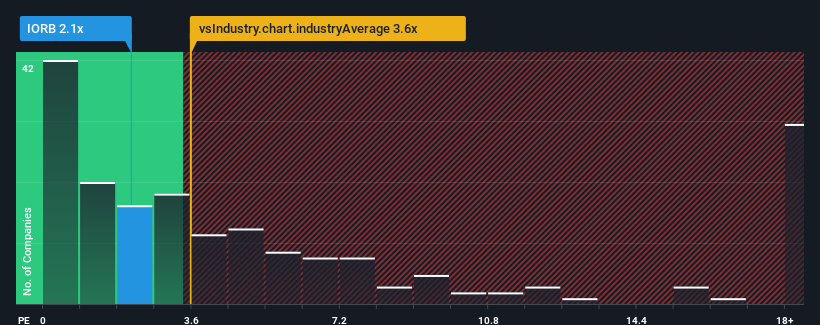
S.C. IOR S.A.'s (BVB:IORB) price-to-sales (or "P/S") ratio of 2.1x might make it look like a buy right now compared to the Market industry in Romania, where around half of the companies have P/S ratios above 3.6x and even P/S above 8x are quite common. However, the P/S might be low for a reason and it requires further investigation to determine if it's justified.
Our free stock report includes 3 warning signs investors should be aware of before investing in S.C. IOR. Read for free now.See our latest analysis for S.C. IOR
How S.C. IOR Has Been Performing
S.C. IOR certainly has been doing a great job lately as it's been growing its revenue at a really rapid pace. One possibility is that the P/S ratio is low because investors think this strong revenue growth might actually underperform the broader industry in the near future. Those who are bullish on S.C. IOR will be hoping that this isn't the case, so that they can pick up the stock at a lower valuation.
Want the full picture on earnings, revenue and cash flow for the company? Then our free report on S.C. IOR will help you shine a light on its historical performance.What Are Revenue Growth Metrics Telling Us About The Low P/S?
In order to justify its P/S ratio, S.C. IOR would need to produce sluggish growth that's trailing the industry.
If we review the last year of revenue growth, the company posted a terrific increase of 172%. The strong recent performance means it was also able to grow revenue by 167% in total over the last three years. Therefore, it's fair to say the revenue growth recently has been superb for the company.
Comparing that to the industry, which is only predicted to deliver 7.9% growth in the next 12 months, the company's momentum is stronger based on recent medium-term annualised revenue results.
In light of this, it's peculiar that S.C. IOR's P/S sits below the majority of other companies. It looks like most investors are not convinced the company can maintain its recent growth rates.
The Final Word
Typically, we'd caution against reading too much into price-to-sales ratios when settling on investment decisions, though it can reveal plenty about what other market participants think about the company.
Our examination of S.C. IOR revealed its three-year revenue trends aren't boosting its P/S anywhere near as much as we would have predicted, given they look better than current industry expectations. When we see strong revenue with faster-than-industry growth, we assume there are some significant underlying risks to the company's ability to make money which is applying downwards pressure on the P/S ratio. At least price risks look to be very low if recent medium-term revenue trends continue, but investors seem to think future revenue could see a lot of volatility.
You should always think about risks. Case in point, we've spotted 3 warning signs for S.C. IOR you should be aware of, and 1 of them doesn't sit too well with us.
If you're unsure about the strength of S.C. IOR's business, why not explore our interactive list of stocks with solid business fundamentals for some other companies you may have missed.
New: Manage All Your Stock Portfolios in One Place
We've created the ultimate portfolio companion for stock investors, and it's free.
• Connect an unlimited number of Portfolios and see your total in one currency
• Be alerted to new Warning Signs or Risks via email or mobile
• Track the Fair Value of your stocks
Have feedback on this article? Concerned about the content? Get in touch with us directly. Alternatively, email editorial-team (at) simplywallst.com.
This article by Simply Wall St is general in nature. We provide commentary based on historical data and analyst forecasts only using an unbiased methodology and our articles are not intended to be financial advice. It does not constitute a recommendation to buy or sell any stock, and does not take account of your objectives, or your financial situation. We aim to bring you long-term focused analysis driven by fundamental data. Note that our analysis may not factor in the latest price-sensitive company announcements or qualitative material. Simply Wall St has no position in any stocks mentioned.
About BVB:IORB
S.C. IOR
Designs, produces, and sells opto-mechanical apparatus in Romania.
Flawless balance sheet slight.
Market Insights


Advertisement
Community Narratives
Alphabet: The Under-appreciated Compounder Hiding in Plain Sight
Fair Value US$282.83|31.8% undervalued
BL
Community Contributor
Planet Labs: At The Heart Of The Emerging New Space Boom
Fair Value US$11.31|44.7% undervalued
AN
Community Contributor
Exxon in Guyana 5 year forecast Low $135 to High $189
Fair Value US$174.00|35.8% undervalued
AG
Community Contributor