
Advertisement
- Romania
- /
- Food and Staples Retail
- /
- BVB:BUCV
S.C. Bucur S.A.'s (BVB:BUCV) Stock Is Rallying But Financials Look Ambiguous: Will The Momentum Continue?

S.C. Bucur's (BVB:BUCV) stock is up by a considerable 18% over the past month. But the company's key financial indicators appear to be differing across the board and that makes us question whether or not the company's current share price momentum can be maintained. In this article, we decided to focus on S.C. Bucur's ROE.
Return on Equity or ROE is a test of how effectively a company is growing its value and managing investors’ money. Put another way, it reveals the company's success at turning shareholder investments into profits.
View our latest analysis for S.C. Bucur
How Do You Calculate Return On Equity?
ROE can be calculated by using the formula:
Return on Equity = Net Profit (from continuing operations) ÷ Shareholders' Equity
So, based on the above formula, the ROE for S.C. Bucur is:
2.2% = RON2.5m ÷ RON109m (Based on the trailing twelve months to September 2023).
The 'return' is the amount earned after tax over the last twelve months. Another way to think of that is that for every RON1 worth of equity, the company was able to earn RON0.02 in profit.
What Is The Relationship Between ROE And Earnings Growth?
So far, we've learned that ROE is a measure of a company's profitability. Depending on how much of these profits the company reinvests or "retains", and how effectively it does so, we are then able to assess a company’s earnings growth potential. Assuming all else is equal, companies that have both a higher return on equity and higher profit retention are usually the ones that have a higher growth rate when compared to companies that don't have the same features.
S.C. Bucur's Earnings Growth And 2.2% ROE
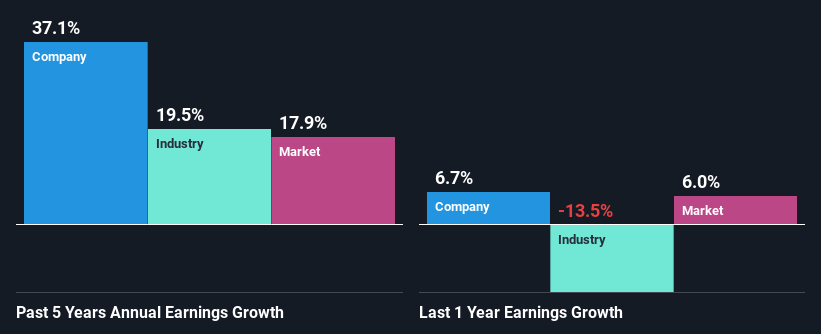
It is quite clear that S.C. Bucur's ROE is rather low. Not just that, even compared to the industry average of 5.2%, the company's ROE is entirely unremarkable. In spite of this, S.C. Bucur was able to grow its net income considerably, at a rate of 37% in the last five years. We reckon that there could be other factors at play here. For example, it is possible that the company's management has made some good strategic decisions, or that the company has a low payout ratio.
We then compared S.C. Bucur's net income growth with the industry and we're pleased to see that the company's growth figure is higher when compared with the industry which has a growth rate of 19% in the same 5-year period.
Earnings growth is an important metric to consider when valuing a stock. What investors need to determine next is if the expected earnings growth, or the lack of it, is already built into the share price. This then helps them determine if the stock is placed for a bright or bleak future. One good indicator of expected earnings growth is the P/E ratio which determines the price the market is willing to pay for a stock based on its earnings prospects. So, you may want to check if S.C. Bucur is trading on a high P/E or a low P/E, relative to its industry.
Is S.C. Bucur Making Efficient Use Of Its Profits?
S.C. Bucur has very a high three-year median payout ratio of 111% suggesting that the company's shareholders are getting paid from more than just the company's earnings. However, this hasn't hampered its ability to grow as we saw earlier. Although, it could be worth keeping an eye on the high payout ratio as that's a huge risk. You can see the 4 risks we have identified for S.C. Bucur by visiting our risks dashboard for free on our platform here.
Along with seeing a growth in earnings, S.C. Bucur only recently started paying dividends. Its quite possible that the company was looking to impress its shareholders.
Conclusion
On the whole, we feel that the performance shown by S.C. Bucur can be open to many interpretations. Although the company has shown a pretty impressive growth in earnings, yet the low ROE and the low rate of reinvestment makes us skeptical about the continuity of that growth, especially when or if the business comes to face any threats. So far, we've only made a quick discussion around the company's earnings growth. To gain further insights into S.C. Bucur's past profit growth, check out this visualization of past earnings, revenue and cash flows.
New: Manage All Your Stock Portfolios in One Place
We've created the ultimate portfolio companion for stock investors, and it's free.
• Connect an unlimited number of Portfolios and see your total in one currency
• Be alerted to new Warning Signs or Risks via email or mobile
• Track the Fair Value of your stocks
Have feedback on this article? Concerned about the content? Get in touch with us directly. Alternatively, email editorial-team (at) simplywallst.com.
This article by Simply Wall St is general in nature. We provide commentary based on historical data and analyst forecasts only using an unbiased methodology and our articles are not intended to be financial advice. It does not constitute a recommendation to buy or sell any stock, and does not take account of your objectives, or your financial situation. We aim to bring you long-term focused analysis driven by fundamental data. Note that our analysis may not factor in the latest price-sensitive company announcements or qualitative material. Simply Wall St has no position in any stocks mentioned.
About BVB:BUCV
S.C. Bucur
Engages in the wholesale and retail of food and non-food products in Europe.
Flawless balance sheet with solid track record.
Market Insights


Advertisement
Community Narratives
MicroStrategy: Volatile Gamble or Golden Opportunity?
Fair Value US$663.00|33.3% undervalued
BL
Community Contributor
Emerging Markets and Debt Reduction Will Propel Bath & Body Works Forward
Fair Value US$40.73|23.4% undervalued
ZW
Community Contributor
An amazing opportunity to potentially get a 100 bagger
Fair Value US$10.00|8.5% overvalued
DA
Community Contributor