
Advertisement
- Qatar
- /
- Wireless Telecom
- /
- DSM:VFQS
Vodafone Qatar P.Q.S.C.'s (DSM:VFQS) Intrinsic Value Is Potentially 46% Above Its Share Price
Key Insights
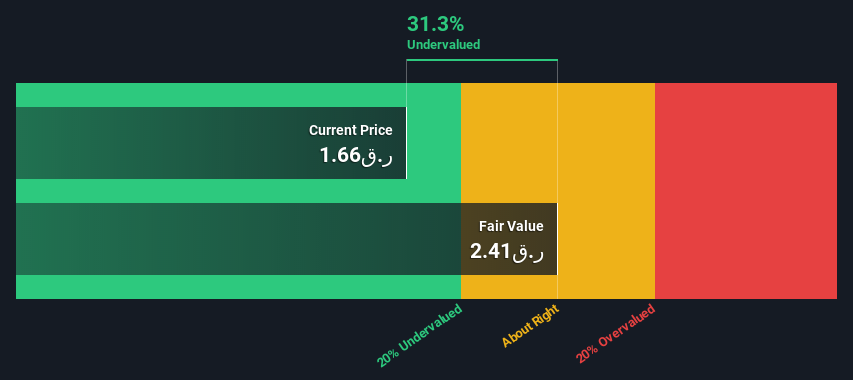
- Using the 2 Stage Free Cash Flow to Equity, Vodafone Qatar P.Q.S.C fair value estimate is ر.ق2.41
- Current share price of ر.ق1.66 suggests Vodafone Qatar P.Q.S.C is potentially 31% undervalued
- Vodafone Qatar P.Q.S.C's peers seem to be trading at a higher discount to fair value based onthe industry average of 33%
In this article we are going to estimate the intrinsic value of Vodafone Qatar P.Q.S.C. (DSM:VFQS) by taking the expected future cash flows and discounting them to today's value. The Discounted Cash Flow (DCF) model is the tool we will apply to do this. Don't get put off by the jargon, the math behind it is actually quite straightforward.
Companies can be valued in a lot of ways, so we would point out that a DCF is not perfect for every situation. If you want to learn more about discounted cash flow, the rationale behind this calculation can be read in detail in the Simply Wall St analysis model.
Check out our latest analysis for Vodafone Qatar P.Q.S.C
What's The Estimated Valuation?
We are going to use a two-stage DCF model, which, as the name states, takes into account two stages of growth. The first stage is generally a higher growth period which levels off heading towards the terminal value, captured in the second 'steady growth' period. To begin with, we have to get estimates of the next ten years of cash flows. Where possible we use analyst estimates, but when these aren't available we extrapolate the previous free cash flow (FCF) from the last estimate or reported value. We assume companies with shrinking free cash flow will slow their rate of shrinkage, and that companies with growing free cash flow will see their growth rate slow, over this period. We do this to reflect that growth tends to slow more in the early years than it does in later years.
Generally we assume that a dollar today is more valuable than a dollar in the future, so we need to discount the sum of these future cash flows to arrive at a present value estimate:
10-year free cash flow (FCF) forecast
| 2023 | 2024 | 2025 | 2026 | 2027 | 2028 | 2029 | 2030 | 2031 | 2032 | |
| Levered FCF (QAR, Millions) | ر.ق477.0m | ر.ق576.0m | ر.ق653.0m | ر.ق723.2m | ر.ق797.0m | ر.ق875.2m | ر.ق958.8m | ر.ق1.05b | ر.ق1.15b | ر.ق1.25b |
| Growth Rate Estimate Source | Analyst x1 | Analyst x2 | Analyst x1 | Est @ 10.75% | Est @ 10.20% | Est @ 9.82% | Est @ 9.55% | Est @ 9.36% | Est @ 9.23% | Est @ 9.14% |
| Present Value (QAR, Millions) Discounted @ 14% | ر.ق417 | ر.ق439 | ر.ق435 | ر.ق421 | ر.ق405 | ر.ق388 | ر.ق372 | ر.ق355 | ر.ق339 | ر.ق323 |
("Est" = FCF growth rate estimated by Simply Wall St)
Present Value of 10-year Cash Flow (PVCF) = ر.ق3.9b
We now need to calculate the Terminal Value, which accounts for all the future cash flows after this ten year period. For a number of reasons a very conservative growth rate is used that cannot exceed that of a country's GDP growth. In this case we have used the 5-year average of the 10-year government bond yield (8.9%) to estimate future growth. In the same way as with the 10-year 'growth' period, we discount future cash flows to today's value, using a cost of equity of 14%.
Terminal Value (TV)= FCF2032 × (1 + g) ÷ (r – g) = ر.ق1.2b× (1 + 8.9%) ÷ (14%– 8.9%) = ر.ق24b
Present Value of Terminal Value (PVTV)= TV / (1 + r)10= ر.ق24b÷ ( 1 + 14%)10= ر.ق6.3b
The total value, or equity value, is then the sum of the present value of the future cash flows, which in this case is ر.ق10b. To get the intrinsic value per share, we divide this by the total number of shares outstanding. Compared to the current share price of ر.ق1.7, the company appears quite undervalued at a 31% discount to where the stock price trades currently. Remember though, that this is just an approximate valuation, and like any complex formula - garbage in, garbage out.
The Assumptions
We would point out that the most important inputs to a discounted cash flow are the discount rate and of course the actual cash flows. You don't have to agree with these inputs, I recommend redoing the calculations yourself and playing with them. The DCF also does not consider the possible cyclicality of an industry, or a company's future capital requirements, so it does not give a full picture of a company's potential performance. Given that we are looking at Vodafone Qatar P.Q.S.C as potential shareholders, the cost of equity is used as the discount rate, rather than the cost of capital (or weighted average cost of capital, WACC) which accounts for debt. In this calculation we've used 14%, which is based on a levered beta of 0.800. Beta is a measure of a stock's volatility, compared to the market as a whole. We get our beta from the industry average beta of globally comparable companies, with an imposed limit between 0.8 and 2.0, which is a reasonable range for a stable business.
SWOT Analysis for Vodafone Qatar P.Q.S.C
Strength
- Earnings growth over the past year exceeded the industry.
- Debt is not viewed as a risk.
- Dividend is in the top 25% of dividend payers in the market.
Weakness
- No major weaknesses identified for VFQS.
Opportunity
- Annual earnings are forecast to grow for the next 3 years.
- Trading below our estimate of fair value by more than 20%.
Threat
- Dividends are not covered by cash flow.
Next Steps:
Valuation is only one side of the coin in terms of building your investment thesis, and it is only one of many factors that you need to assess for a company. The DCF model is not a perfect stock valuation tool. Instead the best use for a DCF model is to test certain assumptions and theories to see if they would lead to the company being undervalued or overvalued. For instance, if the terminal value growth rate is adjusted slightly, it can dramatically alter the overall result. Why is the intrinsic value higher than the current share price? For Vodafone Qatar P.Q.S.C, we've put together three fundamental elements you should assess:
- Risks: To that end, you should be aware of the 1 warning sign we've spotted with Vodafone Qatar P.Q.S.C .
- Future Earnings: How does VFQS's growth rate compare to its peers and the wider market? Dig deeper into the analyst consensus number for the upcoming years by interacting with our free analyst growth expectation chart.
- Other Solid Businesses: Low debt, high returns on equity and good past performance are fundamental to a strong business. Why not explore our interactive list of stocks with solid business fundamentals to see if there are other companies you may not have considered!
PS. The Simply Wall St app conducts a discounted cash flow valuation for every stock on the DSM every day. If you want to find the calculation for other stocks just search here.
New: Manage All Your Stock Portfolios in One Place
We've created the ultimate portfolio companion for stock investors, and it's free.
• Connect an unlimited number of Portfolios and see your total in one currency
• Be alerted to new Warning Signs or Risks via email or mobile
• Track the Fair Value of your stocks
Have feedback on this article? Concerned about the content? Get in touch with us directly. Alternatively, email editorial-team (at) simplywallst.com.
This article by Simply Wall St is general in nature. We provide commentary based on historical data and analyst forecasts only using an unbiased methodology and our articles are not intended to be financial advice. It does not constitute a recommendation to buy or sell any stock, and does not take account of your objectives, or your financial situation. We aim to bring you long-term focused analysis driven by fundamental data. Note that our analysis may not factor in the latest price-sensitive company announcements or qualitative material. Simply Wall St has no position in any stocks mentioned.
About DSM:VFQS
Vodafone Qatar P.Q.S.C
Provides cellular mobile telecommunication, and fixed-line and broadband services in Qatar.
Excellent balance sheet with proven track record and pays a dividend.
Market Insights

Advertisement
Community Narratives
Finding The True Value Of A Logistics Powerhouse
Fair Value US$95.21|8.4% undervalued
NV
Community Contributor
Paradigm Biopharmaceuticals Will Lead Osteoarthritis Treatment with Zilosul's FDA Success
Fair Value AU$5.50|92.1% undervalued
AM
Community Contributor
Barrick Mining (ABX:CA): A Gold Hedge against a U.S. Shutdown
Fair Value CA$60.00|24.2% undervalued
GM
Community Contributor