- Qatar
- /
- Wireless Telecom
- /
- DSM:VFQS
Investors in Vodafone Qatar P.Q.S.C (DSM:VFQS) have seen notable returns of 65% over the past three years


By buying an index fund, investors can approximate the average market return. But if you buy good businesses at attractive prices, your portfolio returns could exceed the average market return. For example, the Vodafone Qatar P.Q.S.C. (DSM:VFQS) share price is up 45% in the last three years, clearly besting the market return of around 3.4% (not including dividends). On the other hand, the returns haven't been quite so good recently, with shareholders up just 25% , including dividends .
So let's investigate and see if the longer term performance of the company has been in line with the underlying business' progress.
View our latest analysis for Vodafone Qatar P.Q.S.C
While the efficient markets hypothesis continues to be taught by some, it has been proven that markets are over-reactive dynamic systems, and investors are not always rational. One flawed but reasonable way to assess how sentiment around a company has changed is to compare the earnings per share (EPS) with the share price.
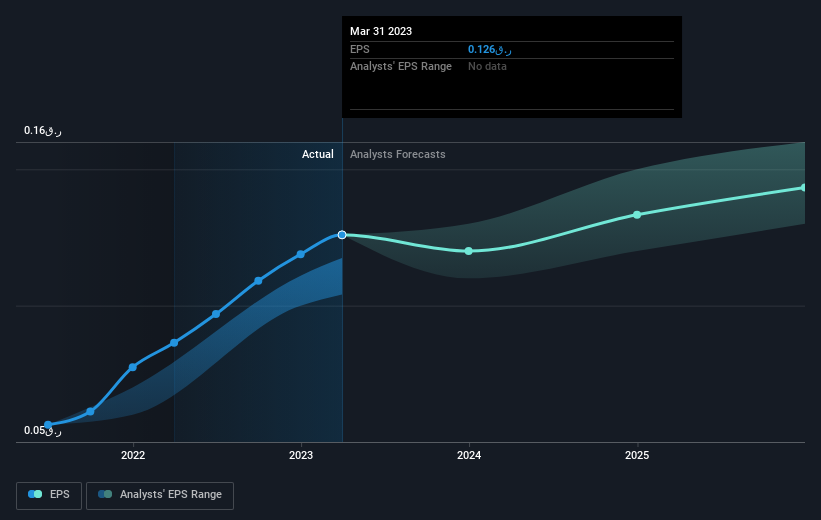
During three years of share price growth, Vodafone Qatar P.Q.S.C achieved compound earnings per share growth of 53% per year. This EPS growth is higher than the 13% average annual increase in the share price. So it seems investors have become more cautious about the company, over time.
You can see below how EPS has changed over time (discover the exact values by clicking on the image).
We know that Vodafone Qatar P.Q.S.C has improved its bottom line over the last three years, but what does the future have in store? It might be well worthwhile taking a look at our free report on how its financial position has changed over time.
What About Dividends?
As well as measuring the share price return, investors should also consider the total shareholder return (TSR). Whereas the share price return only reflects the change in the share price, the TSR includes the value of dividends (assuming they were reinvested) and the benefit of any discounted capital raising or spin-off. So for companies that pay a generous dividend, the TSR is often a lot higher than the share price return. As it happens, Vodafone Qatar P.Q.S.C's TSR for the last 3 years was 65%, which exceeds the share price return mentioned earlier. And there's no prize for guessing that the dividend payments largely explain the divergence!
A Different Perspective
It's good to see that Vodafone Qatar P.Q.S.C has rewarded shareholders with a total shareholder return of 25% in the last twelve months. And that does include the dividend. That gain is better than the annual TSR over five years, which is 4%. Therefore it seems like sentiment around the company has been positive lately. In the best case scenario, this may hint at some real business momentum, implying that now could be a great time to delve deeper. It's always interesting to track share price performance over the longer term. But to understand Vodafone Qatar P.Q.S.C better, we need to consider many other factors. For instance, we've identified 1 warning sign for Vodafone Qatar P.Q.S.C that you should be aware of.
If you would prefer to check out another company -- one with potentially superior financials -- then do not miss this free list of companies that have proven they can grow earnings.
Please note, the market returns quoted in this article reflect the market weighted average returns of stocks that currently trade on Qatari exchanges.
New: Manage All Your Stock Portfolios in One Place
We've created the ultimate portfolio companion for stock investors, and it's free.
• Connect an unlimited number of Portfolios and see your total in one currency
• Be alerted to new Warning Signs or Risks via email or mobile
• Track the Fair Value of your stocks
Have feedback on this article? Concerned about the content? Get in touch with us directly. Alternatively, email editorial-team (at) simplywallst.com.
This article by Simply Wall St is general in nature. We provide commentary based on historical data and analyst forecasts only using an unbiased methodology and our articles are not intended to be financial advice. It does not constitute a recommendation to buy or sell any stock, and does not take account of your objectives, or your financial situation. We aim to bring you long-term focused analysis driven by fundamental data. Note that our analysis may not factor in the latest price-sensitive company announcements or qualitative material. Simply Wall St has no position in any stocks mentioned.
About DSM:VFQS
Vodafone Qatar P.Q.S.C
Provides cellular mobile telecommunication and fixed-line broadband services for consumers and businesses in Qatar.
Established dividend payer and good value.

