Is Planet B2B S.A.'s (WSE:P2B) Recent Stock Performance Influenced By Its Fundamentals In Any Way?

Planet B2B's (WSE:P2B) stock is up by a considerable 10.0% over the past three months. Given that stock prices are usually aligned with a company's financial performance in the long-term, we decided to study its financial indicators more closely to see if they had a hand to play in the recent price move. Specifically, we decided to study Planet B2B's ROE in this article.
ROE or return on equity is a useful tool to assess how effectively a company can generate returns on the investment it received from its shareholders. In simpler terms, it measures the profitability of a company in relation to shareholder's equity.
View our latest analysis for Planet B2B
How Is ROE Calculated?
ROE can be calculated by using the formula:
Return on Equity = Net Profit (from continuing operations) ÷ Shareholders' Equity
So, based on the above formula, the ROE for Planet B2B is:
37% = zł115k ÷ zł307k (Based on the trailing twelve months to September 2020).
The 'return' is the amount earned after tax over the last twelve months. One way to conceptualize this is that for each PLN1 of shareholders' capital it has, the company made PLN0.37 in profit.
What Is The Relationship Between ROE And Earnings Growth?
We have already established that ROE serves as an efficient profit-generating gauge for a company's future earnings. Based on how much of its profits the company chooses to reinvest or "retain", we are then able to evaluate a company's future ability to generate profits. Assuming everything else remains unchanged, the higher the ROE and profit retention, the higher the growth rate of a company compared to companies that don't necessarily bear these characteristics.
Planet B2B's Earnings Growth And 37% ROE
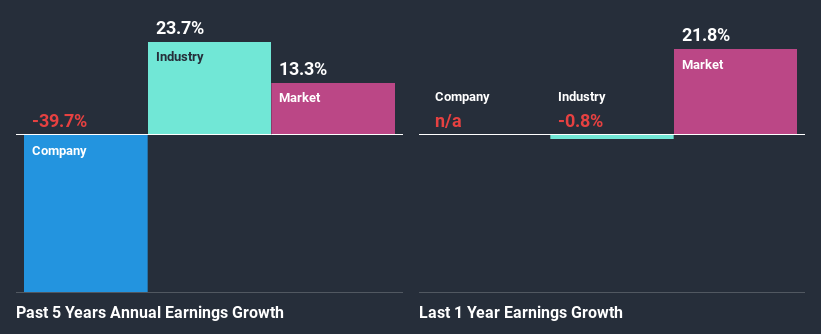
First thing first, we like that Planet B2B has an impressive ROE. Second, a comparison with the average ROE reported by the industry of 17% also doesn't go unnoticed by us. For this reason, Planet B2B's five year net income decline of 40% raises the question as to why the high ROE didn't translate into earnings growth. Based on this, we feel that there might be other reasons which haven't been discussed so far in this article that could be hampering the company's growth. These include low earnings retention or poor allocation of capital.
That being said, we compared Planet B2B's performance with the industry and were concerned when we found that while the company has shrunk its earnings, the industry has grown its earnings at a rate of 24% in the same period.
Earnings growth is an important metric to consider when valuing a stock. What investors need to determine next is if the expected earnings growth, or the lack of it, is already built into the share price. Doing so will help them establish if the stock's future looks promising or ominous. Is Planet B2B fairly valued compared to other companies? These 3 valuation measures might help you decide.
Is Planet B2B Making Efficient Use Of Its Profits?
Conclusion
On the whole, we do feel that Planet B2B has some positive attributes. However, given the high ROE and high profit retention, we would expect the company to be delivering strong earnings growth, but that isn't the case here. This suggests that there might be some external threat to the business, that's hampering its growth. While we won't completely dismiss the company, what we would do, is try to ascertain how risky the business is to make a more informed decision around the company. To know the 3 risks we have identified for Planet B2B visit our risks dashboard for free.
If you decide to trade Planet B2B, use the lowest-cost* platform that is rated #1 Overall by Barron’s, Interactive Brokers. Trade stocks, options, futures, forex, bonds and funds on 135 markets, all from a single integrated account. Promoted
Mobile Infrastructure for Defense and Disaster
The next wave in robotics isn't humanoid. Its fully autonomous towers delivering 5G, ISR, and radar in under 30 minutes, anywhere.
Get the investor briefing before the next round of contracts
Sponsored On Behalf of CiTechNew: Manage All Your Stock Portfolios in One Place
We've created the ultimate portfolio companion for stock investors, and it's free.
• Connect an unlimited number of Portfolios and see your total in one currency
• Be alerted to new Warning Signs or Risks via email or mobile
• Track the Fair Value of your stocks
This article by Simply Wall St is general in nature. It does not constitute a recommendation to buy or sell any stock, and does not take account of your objectives, or your financial situation. We aim to bring you long-term focused analysis driven by fundamental data. Note that our analysis may not factor in the latest price-sensitive company announcements or qualitative material. Simply Wall St has no position in any stocks mentioned.
*Interactive Brokers Rated Lowest Cost Broker by StockBrokers.com Annual Online Review 2020
Have feedback on this article? Concerned about the content? Get in touch with us directly. Alternatively, email editorial-team (at) simplywallst.com.
About WSE:P2B
Flawless balance sheet with solid track record.
Market Insights

Weekly Picks

Early mover in a fast growing industry. Likely to experience share price volatility as they scale


A case for CA$31.80 (undiluted), aka 8,616% upside from CA$0.37 (an 86 bagger!).


Moderation and Stabilisation: HOLD: Fair Price based on a 4-year Cycle is $12.08
Recently Updated Narratives

Airbnb Stock: Platform Growth in a World of Saturation and Scrutiny

Clarivate Stock: When Data Becomes the Backbone of Innovation and Law

Adobe Stock: AI-Fueled ARR Growth Pushes Guidance Higher, But Cost Pressures Loom
Popular Narratives


Crazy Undervalued 42 Baggers Silver Play (Active & Running Mine)


NVDA: Expanding AI Demand Will Drive Major Data Center Investments Through 2026


MicroVision will explode future revenue by 380.37% with a vision towards success
Trending Discussion
