
Advertisement
Market Participants Recognise e-Xim IT S.A.'s (WSE:EXM) Earnings Pushing Shares 28% Higher
e-Xim IT S.A. (WSE:EXM) shareholders are no doubt pleased to see that the share price has bounced 28% in the last month, although it is still struggling to make up recently lost ground. Looking back a bit further, it's encouraging to see the stock is up 47% in the last year.
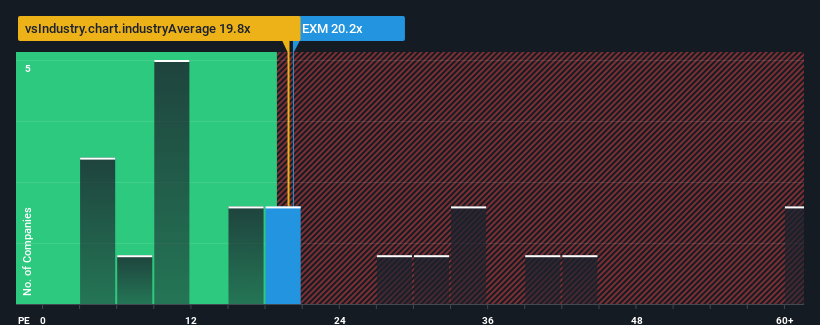
Since its price has surged higher, given around half the companies in Poland have price-to-earnings ratios (or "P/E's") below 13x, you may consider e-Xim IT as a stock to potentially avoid with its 20.2x P/E ratio. However, the P/E might be high for a reason and it requires further investigation to determine if it's justified.
As an illustration, earnings have deteriorated at e-Xim IT over the last year, which is not ideal at all. One possibility is that the P/E is high because investors think the company will still do enough to outperform the broader market in the near future. If not, then existing shareholders may be quite nervous about the viability of the share price.
View our latest analysis for e-Xim IT
Does Growth Match The High P/E?
e-Xim IT's P/E ratio would be typical for a company that's expected to deliver solid growth, and importantly, perform better than the market.
Taking a look back first, the company's earnings per share growth last year wasn't something to get excited about as it posted a disappointing decline of 14%. However, a few very strong years before that means that it was still able to grow EPS by an impressive 312% in total over the last three years. Although it's been a bumpy ride, it's still fair to say the earnings growth recently has been more than adequate for the company.
This is in contrast to the rest of the market, which is expected to grow by 12% over the next year, materially lower than the company's recent medium-term annualised growth rates.
In light of this, it's understandable that e-Xim IT's P/E sits above the majority of other companies. Presumably shareholders aren't keen to offload something they believe will continue to outmanoeuvre the bourse.
The Bottom Line On e-Xim IT's P/E
e-Xim IT's P/E is getting right up there since its shares have risen strongly. We'd say the price-to-earnings ratio's power isn't primarily as a valuation instrument but rather to gauge current investor sentiment and future expectations.
We've established that e-Xim IT maintains its high P/E on the strength of its recent three-year growth being higher than the wider market forecast, as expected. At this stage investors feel the potential for a deterioration in earnings isn't great enough to justify a lower P/E ratio. Unless the recent medium-term conditions change, they will continue to provide strong support to the share price.
Plus, you should also learn about these 3 warning signs we've spotted with e-Xim IT (including 2 which make us uncomfortable).
You might be able to find a better investment than e-Xim IT. If you want a selection of possible candidates, check out this free list of interesting companies that trade on a low P/E (but have proven they can grow earnings).
New: Manage All Your Stock Portfolios in One Place
We've created the ultimate portfolio companion for stock investors, and it's free.
• Connect an unlimited number of Portfolios and see your total in one currency
• Be alerted to new Warning Signs or Risks via email or mobile
• Track the Fair Value of your stocks
Have feedback on this article? Concerned about the content? Get in touch with us directly. Alternatively, email editorial-team (at) simplywallst.com.
This article by Simply Wall St is general in nature. We provide commentary based on historical data and analyst forecasts only using an unbiased methodology and our articles are not intended to be financial advice. It does not constitute a recommendation to buy or sell any stock, and does not take account of your objectives, or your financial situation. We aim to bring you long-term focused analysis driven by fundamental data. Note that our analysis may not factor in the latest price-sensitive company announcements or qualitative material. Simply Wall St has no position in any stocks mentioned.
About WSE:EXM
e-Xim IT
Provides IT management solutions in the automation, service management, environment simulation, API management, and cyber.
Flawless balance sheet with low risk.
Market Insights

Advertisement
Community Narratives
MINISO's fair value is projected at 26.69 with an anticipated PE ratio shift of 20x
Fair Value US$24.03|9.0% undervalued
BE
Community Contributor
Procter & Gamble: A Dividend Giant Facing Slowing Growth
Fair Value US$119.81|23.5% overvalued
AN
Community Contributor
Eli Lilly's Future Growth Driven by Tirzepatide and Favorable Market Conditions
Fair Value US$1.19k|14.4% undervalued
EA
Community Contributor