
Advertisement
What trends should we look for it we want to identify stocks that can multiply in value over the long term? Ideally, a business will show two trends; firstly a growing return on capital employed (ROCE) and secondly, an increasing amount of capital employed. This shows us that it's a compounding machine, able to continually reinvest its earnings back into the business and generate higher returns. That's why when we briefly looked at ESOTIQ & Henderson's (WSE:EAH) ROCE trend, we were pretty happy with what we saw.
Return On Capital Employed (ROCE): What Is It?
If you haven't worked with ROCE before, it measures the 'return' (pre-tax profit) a company generates from capital employed in its business. Analysts use this formula to calculate it for ESOTIQ & Henderson:
Return on Capital Employed = Earnings Before Interest and Tax (EBIT) ÷ (Total Assets - Current Liabilities)
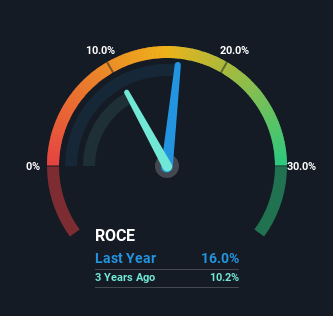
0.16 = zł13m ÷ (zł139m - zł56m) (Based on the trailing twelve months to September 2023).
Thus, ESOTIQ & Henderson has an ROCE of 16%. By itself that's a normal return on capital and it's in line with the industry's average returns of 16%.
See our latest analysis for ESOTIQ & Henderson
While the past is not representative of the future, it can be helpful to know how a company has performed historically, which is why we have this chart above. If you'd like to look at how ESOTIQ & Henderson has performed in the past in other metrics, you can view this free graph of ESOTIQ & Henderson's past earnings, revenue and cash flow.
The Trend Of ROCE
The trend of ROCE doesn't stand out much, but returns on a whole are decent. Over the past five years, ROCE has remained relatively flat at around 16% and the business has deployed 70% more capital into its operations. Since 16% is a moderate ROCE though, it's good to see a business can continue to reinvest at these decent rates of return. Stable returns in this ballpark can be unexciting, but if they can be maintained over the long run, they often provide nice rewards to shareholders.
Another thing to note, ESOTIQ & Henderson has a high ratio of current liabilities to total assets of 40%. This effectively means that suppliers (or short-term creditors) are funding a large portion of the business, so just be aware that this can introduce some elements of risk. While it's not necessarily a bad thing, it can be beneficial if this ratio is lower.
Our Take On ESOTIQ & Henderson's ROCE
The main thing to remember is that ESOTIQ & Henderson has proven its ability to continually reinvest at respectable rates of return. On top of that, the stock has rewarded shareholders with a remarkable 116% return to those who've held over the last five years. So while investors seem to be recognizing these promising trends, we still believe the stock deserves further research.
On a separate note, we've found 4 warning signs for ESOTIQ & Henderson you'll probably want to know about.
While ESOTIQ & Henderson isn't earning the highest return, check out this free list of companies that are earning high returns on equity with solid balance sheets.
Valuation is complex, but we're here to simplify it.
Discover if ESOTIQ & Henderson might be undervalued or overvalued with our detailed analysis, featuring fair value estimates, potential risks, dividends, insider trades, and its financial condition.
Access Free AnalysisHave feedback on this article? Concerned about the content? Get in touch with us directly. Alternatively, email editorial-team (at) simplywallst.com.
This article by Simply Wall St is general in nature. We provide commentary based on historical data and analyst forecasts only using an unbiased methodology and our articles are not intended to be financial advice. It does not constitute a recommendation to buy or sell any stock, and does not take account of your objectives, or your financial situation. We aim to bring you long-term focused analysis driven by fundamental data. Note that our analysis may not factor in the latest price-sensitive company announcements or qualitative material. Simply Wall St has no position in any stocks mentioned.
About WSE:EAH
ESOTIQ & Henderson
Designs, manufactures, and sells lingerie, clothing, and cosmetics in Poland and internationally.
Medium-low risk and fair value.
Market Insights

Advertisement
Community Narratives
MicroVision will explode future revenue by 380.37% with a vision towards success
Fair Value US$60.00|98.4% undervalued
TH
Community Contributor
The Indispensable Artery for a New North American Economy
Fair Value CA$132.87|1.3% undervalued
TI
Community Contributor