
Advertisement
- Poland
- /
- Professional Services
- /
- WSE:TXN
Why We Like Tax-Net S.A.’s (WSE:TXN) 8.1% Return On Capital Employed
Today we are going to look at Tax-Net S.A. (WSE:TXN) to see whether it might be an attractive investment prospect. In particular, we'll consider its Return On Capital Employed (ROCE), as that can give us insight into how profitably the company is able to employ capital in its business.
First of all, we'll work out how to calculate ROCE. Then we'll compare its ROCE to similar companies. Then we'll determine how its current liabilities are affecting its ROCE.
What is Return On Capital Employed (ROCE)?
ROCE is a measure of a company's yearly pre-tax profit (its return), relative to the capital employed in the business. In general, businesses with a higher ROCE are usually better quality. Overall, it is a valuable metric that has its flaws. Renowned investment researcher Michael Mauboussin has suggested that a high ROCE can indicate that 'one dollar invested in the company generates value of more than one dollar'.
So, How Do We Calculate ROCE?
Analysts use this formula to calculate return on capital employed:
Return on Capital Employed = Earnings Before Interest and Tax (EBIT) ÷ (Total Assets - Current Liabilities)
Or for Tax-Net:
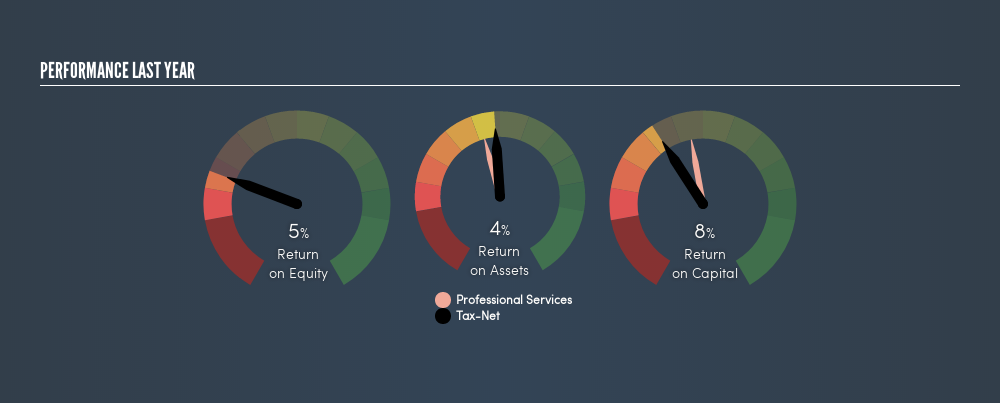
0.081 = zł419k ÷ (zł6.4m - zł1.2m) (Based on the trailing twelve months to March 2019.)
So, Tax-Net has an ROCE of 8.1%.
See our latest analysis for Tax-Net
Is Tax-Net's ROCE Good?
ROCE can be useful when making comparisons, such as between similar companies. In our analysis, Tax-Net's ROCE is meaningfully higher than the 3.8% average in the Professional Services industry. I think that's good to see, since it implies the company is better than other companies at making the most of its capital. Separate from how Tax-Net stacks up against its industry, its ROCE in absolute terms is mediocre; relative to the returns on government bonds. Readers may find more attractive investment prospects elsewhere.
Tax-Net's current ROCE of 8.1% is lower than its ROCE in the past, which was 11%, 3 years ago. This makes us wonder if the business is facing new challenges.
When considering this metric, keep in mind that it is backwards looking, and not necessarily predictive. Companies in cyclical industries can be difficult to understand using ROCE, as returns typically look high during boom times, and low during busts. This is because ROCE only looks at one year, instead of considering returns across a whole cycle. If Tax-Net is cyclical, it could make sense to check out this free graph of past earnings, revenue and cash flow.
What Are Current Liabilities, And How Do They Affect Tax-Net's ROCE?
Current liabilities include invoices, such as supplier payments, short-term debt, or a tax bill, that need to be paid within 12 months. The ROCE equation subtracts current liabilities from capital employed, so a company with a lot of current liabilities appears to have less capital employed, and a higher ROCE than otherwise. To counteract this, we check if a company has high current liabilities, relative to its total assets.
Tax-Net has total liabilities of zł1.2m and total assets of zł6.4m. Therefore its current liabilities are equivalent to approximately 18% of its total assets. It is good to see a restrained amount of current liabilities, as this limits the effect on ROCE.
Our Take On Tax-Net's ROCE
If Tax-Net continues to earn an uninspiring ROCE, there may be better places to invest. Of course, you might also be able to find a better stock than Tax-Net. So you may wish to see this free collection of other companies that have grown earnings strongly.
If you are like me, then you will not want to miss this free list of growing companies that insiders are buying.
We aim to bring you long-term focused research analysis driven by fundamental data. Note that our analysis may not factor in the latest price-sensitive company announcements or qualitative material.
If you spot an error that warrants correction, please contact the editor at editorial-team@simplywallst.com. This article by Simply Wall St is general in nature. It does not constitute a recommendation to buy or sell any stock, and does not take account of your objectives, or your financial situation. Simply Wall St has no position in the stocks mentioned. Thank you for reading.
About WSE:TXN
Tax-Net
Provides accounting and tax financial advisory services in Poland.
Flawless balance sheet and good value.
Market Insights

Advertisement
Community Narratives
MINISO's fair value is projected at 26.69 with an anticipated PE ratio shift of 20x
Fair Value US$24.03|11.0% undervalued
BE
Community Contributor
Procter & Gamble: A Dividend Giant Facing Slowing Growth
Fair Value US$119.81|23.3% overvalued
AN
Community Contributor
Eli Lilly's Future Growth Driven by Tirzepatide and Favorable Market Conditions
Fair Value US$1.19k|13.8% undervalued
EA
Community Contributor