
Advertisement
- Poland
- /
- Professional Services
- /
- WSE:ASM
Insufficient Growth At ASM Group S.A. (WSE:ASM) Hampers Share Price
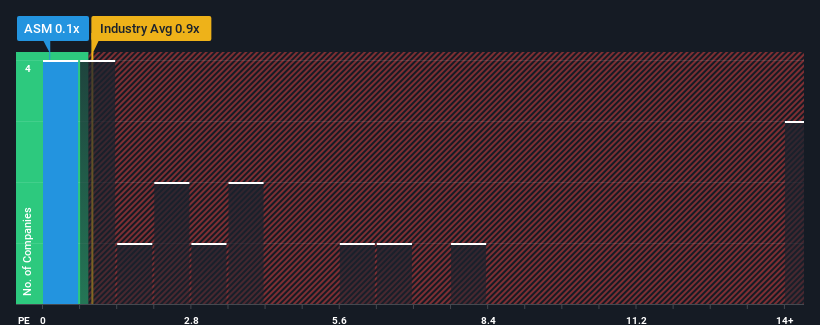
With a price-to-sales (or "P/S") ratio of 0.1x ASM Group S.A. (WSE:ASM) may be sending very bullish signals at the moment, given that almost half of all the Professional Services companies in Poland have P/S ratios greater than 2.4x and even P/S higher than 6x are not unusual. However, the P/S might be quite low for a reason and it requires further investigation to determine if it's justified.
See our latest analysis for ASM Group
What Does ASM Group's Recent Performance Look Like?
Revenue has risen firmly for ASM Group recently, which is pleasing to see. It might be that many expect the respectable revenue performance to degrade substantially, which has repressed the P/S. If that doesn't eventuate, then existing shareholders have reason to be optimistic about the future direction of the share price.
Although there are no analyst estimates available for ASM Group, take a look at this free data-rich visualisation to see how the company stacks up on earnings, revenue and cash flow.How Is ASM Group's Revenue Growth Trending?
There's an inherent assumption that a company should far underperform the industry for P/S ratios like ASM Group's to be considered reasonable.
Retrospectively, the last year delivered a decent 7.9% gain to the company's revenues. However, this wasn't enough as the latest three year period has seen an unpleasant 53% overall drop in revenue. Therefore, it's fair to say the revenue growth recently has been undesirable for the company.
Comparing that to the industry, which is predicted to deliver 3.8% growth in the next 12 months, the company's downward momentum based on recent medium-term revenue results is a sobering picture.
With this in mind, we understand why ASM Group's P/S is lower than most of its industry peers. Nonetheless, there's no guarantee the P/S has reached a floor yet with revenue going in reverse. Even just maintaining these prices could be difficult to achieve as recent revenue trends are already weighing down the shares.
The Bottom Line On ASM Group's P/S
Using the price-to-sales ratio alone to determine if you should sell your stock isn't sensible, however it can be a practical guide to the company's future prospects.
Our examination of ASM Group confirms that the company's shrinking revenue over the past medium-term is a key factor in its low price-to-sales ratio, given the industry is projected to grow. Right now shareholders are accepting the low P/S as they concede future revenue probably won't provide any pleasant surprises either. Unless the recent medium-term conditions improve, they will continue to form a barrier for the share price around these levels.
You should always think about risks. Case in point, we've spotted 4 warning signs for ASM Group you should be aware of.
It's important to make sure you look for a great company, not just the first idea you come across. So if growing profitability aligns with your idea of a great company, take a peek at this free list of interesting companies with strong recent earnings growth (and a low P/E).
New: Manage All Your Stock Portfolios in One Place
We've created the ultimate portfolio companion for stock investors, and it's free.
• Connect an unlimited number of Portfolios and see your total in one currency
• Be alerted to new Warning Signs or Risks via email or mobile
• Track the Fair Value of your stocks
Have feedback on this article? Concerned about the content? Get in touch with us directly. Alternatively, email editorial-team (at) simplywallst.com.
This article by Simply Wall St is general in nature. We provide commentary based on historical data and analyst forecasts only using an unbiased methodology and our articles are not intended to be financial advice. It does not constitute a recommendation to buy or sell any stock, and does not take account of your objectives, or your financial situation. We aim to bring you long-term focused analysis driven by fundamental data. Note that our analysis may not factor in the latest price-sensitive company announcements or qualitative material. Simply Wall St has no position in any stocks mentioned.
About WSE:ASM
ASM Group
Through its subsidiaries, provides sales support and outsourcing services in Poland, Italy, Germany, Austria, and Switzerland.
Adequate balance sheet with low risk.
Market Insights

Advertisement
Community Narratives
MicroVision will explode future revenue by 380.37% with a vision towards success
Fair Value US$60|98.4% undervalued
TH
Community Contributor
The Indispensable Artery for a New North American Economy
Fair Value CA$132.87|0.7% overvalued
TI
Community Contributor
Recently Updated Narratives
CE

cementafriend on Constellation Energy ·
Constellation Energy Dividends and Growth
Fair Value:US$348.054.7% overvalued
2 followersusers have followed this narrative
0 commentsusers have commented on this narrative
0 likesusers have liked this narrative
KH

Khagani on CoreWeave ·
CoreWeave's Revenue Expected to Rocket 77.88% in 5-Year Forecast
Fair Value:US$11033.5% undervalued
1 followerusers have followed this narrative
0 commentsusers have commented on this narrative
0 likesusers have liked this narrative
PO

PortfolioPlus on Bisalloy Steel Group ·
Bisalloy Steel Group will shine with a projected profit margin increase of 12.8%
Fair Value:AU$6.7118.0% undervalued
2 followersusers have followed this narrative
0 commentsusers have commented on this narrative
0 likesusers have liked this narrative
Popular Narratives
TH

TheWallstreetKing on MicroVision ·
MicroVision will explode future revenue by 380.37% with a vision towards success
Fair Value:US$6098.4% undervalued
102 followersusers have followed this narrative
10 commentsusers have commented on this narrative
20 likesusers have liked this narrative
AN


AnalystConsensusTarget on NVIDIA ·
NVDA: Expanding AI Demand Will Drive Major Data Center Investments Through 2026
Fair Value:US$250.3929.3% undervalued
936 followersusers have followed this narrative
6 commentsusers have commented on this narrative
23 likesusers have liked this narrative
OS


oscargarcia on Alphabet ·
The company that turned a verb into a global necessity and basically runs the modern internet, digital ads, smartphones, maps, and AI.
Fair Value:US$3405.8% undervalued
140 followersusers have followed this narrative
6 commentsusers have commented on this narrative
18 likesusers have liked this narrative