
Advertisement
- Poland
- /
- Professional Services
- /
- WSE:ECN
Does The Market Have A Low Tolerance For Acartus S.A.'s (WSE:ACA) Mixed Fundamentals?

It is hard to get excited after looking at Acartus' (WSE:ACA) recent performance, when its stock has declined 12% over the past week. We, however decided to study the company's financials to determine if they have got anything to do with the price decline. Stock prices are usually driven by a company’s financial performance over the long term, and therefore we decided to pay more attention to the company's financial performance. Specifically, we decided to study Acartus' ROE in this article.
ROE or return on equity is a useful tool to assess how effectively a company can generate returns on the investment it received from its shareholders. In short, ROE shows the profit each dollar generates with respect to its shareholder investments.
View our latest analysis for Acartus
How Is ROE Calculated?
The formula for ROE is:
Return on Equity = Net Profit (from continuing operations) ÷ Shareholders' Equity
So, based on the above formula, the ROE for Acartus is:
9.4% = zł96k ÷ zł1.0m (Based on the trailing twelve months to December 2021).
The 'return' is the profit over the last twelve months. So, this means that for every PLN1 of its shareholder's investments, the company generates a profit of PLN0.09.
What Is The Relationship Between ROE And Earnings Growth?
Thus far, we have learned that ROE measures how efficiently a company is generating its profits. Based on how much of its profits the company chooses to reinvest or "retain", we are then able to evaluate a company's future ability to generate profits. Assuming everything else remains unchanged, the higher the ROE and profit retention, the higher the growth rate of a company compared to companies that don't necessarily bear these characteristics.
Acartus' Earnings Growth And 9.4% ROE
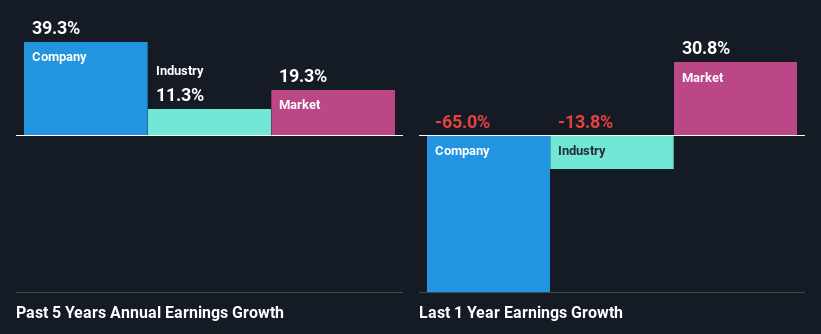
On the face of it, Acartus' ROE is not much to talk about. A quick further study shows that the company's ROE doesn't compare favorably to the industry average of 16% either. In spite of this, Acartus was able to grow its net income considerably, at a rate of 39% in the last five years. We reckon that there could be other factors at play here. For example, it is possible that the company's management has made some good strategic decisions, or that the company has a low payout ratio.
Next, on comparing with the industry net income growth, we found that Acartus' growth is quite high when compared to the industry average growth of 11% in the same period, which is great to see.
Earnings growth is an important metric to consider when valuing a stock. The investor should try to establish if the expected growth or decline in earnings, whichever the case may be, is priced in. By doing so, they will have an idea if the stock is headed into clear blue waters or if swampy waters await. One good indicator of expected earnings growth is the P/E ratio which determines the price the market is willing to pay for a stock based on its earnings prospects. So, you may want to check if Acartus is trading on a high P/E or a low P/E, relative to its industry.
Is Acartus Efficiently Re-investing Its Profits?
Acartus has very a high three-year median payout ratio of 234% suggesting that the company's shareholders are getting paid from more than just the company's earnings. Despite this, the company's earnings grew significantly as we saw above. Although, it could be worth keeping an eye on the high payout ratio as that's a huge risk. Our risks dashboard should have the 4 risks we have identified for Acartus.
Besides, Acartus has been paying dividends over a period of six years. This shows that the company is committed to sharing profits with its shareholders.
Conclusion
On the whole, we feel that the performance shown by Acartus can be open to many interpretations. Although the company has shown a pretty impressive growth in earnings, yet the low ROE and the low rate of reinvestment makes us skeptical about the continuity of that growth, especially when or if the business comes to face any threats. So far, we've only made a quick discussion around the company's earnings growth. You can do your own research on Acartus and see how it has performed in the past by looking at this FREE detailed graph of past earnings, revenue and cash flows.
Valuation is complex, but we're here to simplify it.
Discover if Ecnology Group might be undervalued or overvalued with our detailed analysis, featuring fair value estimates, potential risks, dividends, insider trades, and its financial condition.
Access Free AnalysisHave feedback on this article? Concerned about the content? Get in touch with us directly. Alternatively, email editorial-team (at) simplywallst.com.
This article by Simply Wall St is general in nature. We provide commentary based on historical data and analyst forecasts only using an unbiased methodology and our articles are not intended to be financial advice. It does not constitute a recommendation to buy or sell any stock, and does not take account of your objectives, or your financial situation. We aim to bring you long-term focused analysis driven by fundamental data. Note that our analysis may not factor in the latest price-sensitive company announcements or qualitative material. Simply Wall St has no position in any stocks mentioned.
About WSE:ECN
Ecnology Group
Engages in the provision of financial consultancy services in Poland.
Flawless balance sheet slight.
Market Insights


Advertisement
Community Narratives
MicroStrategy: Volatile Gamble or Golden Opportunity?
Fair Value US$663.00|33.3% undervalued
BL
Community Contributor
Emerging Markets and Debt Reduction Will Propel Bath & Body Works Forward
Fair Value US$40.73|23.4% undervalued
ZW
Community Contributor
An amazing opportunity to potentially get a 100 bagger
Fair Value US$10.00|8.5% overvalued
DA
Community Contributor