
Advertisement
Feerum's (WSE:FEE) Returns On Capital Tell Us There Is Reason To Feel Uneasy
When we're researching a company, it's sometimes hard to find the warning signs, but there are some financial metrics that can help spot trouble early. When we see a declining return on capital employed (ROCE) in conjunction with a declining base of capital employed, that's often how a mature business shows signs of aging. This combination can tell you that not only is the company investing less, it's earning less on what it does invest. So after glancing at the trends within Feerum (WSE:FEE), we weren't too hopeful.
Understanding Return On Capital Employed (ROCE)
If you haven't worked with ROCE before, it measures the 'return' (pre-tax profit) a company generates from capital employed in its business. Analysts use this formula to calculate it for Feerum:
Return on Capital Employed = Earnings Before Interest and Tax (EBIT) ÷ (Total Assets - Current Liabilities)
0.013 = zł1.5m ÷ (zł149m - zł27m) (Based on the trailing twelve months to September 2024).
So, Feerum has an ROCE of 1.3%. Ultimately, that's a low return and it under-performs the Machinery industry average of 10%.
See our latest analysis for Feerum
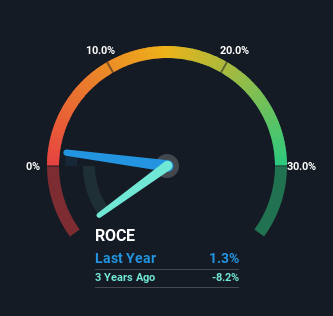
Historical performance is a great place to start when researching a stock so above you can see the gauge for Feerum's ROCE against it's prior returns. If you're interested in investigating Feerum's past further, check out this free graph covering Feerum's past earnings, revenue and cash flow .
What Does the ROCE Trend For Feerum Tell Us?
We are a bit worried about the trend of returns on capital at Feerum. About five years ago, returns on capital were 11%, however they're now substantially lower than that as we saw above. Meanwhile, capital employed in the business has stayed roughly the flat over the period. Companies that exhibit these attributes tend to not be shrinking, but they can be mature and facing pressure on their margins from competition. If these trends continue, we wouldn't expect Feerum to turn into a multi-bagger.
On a side note, Feerum has done well to pay down its current liabilities to 18% of total assets. So we could link some of this to the decrease in ROCE. What's more, this can reduce some aspects of risk to the business because now the company's suppliers or short-term creditors are funding less of its operations. Since the business is basically funding more of its operations with it's own money, you could argue this has made the business less efficient at generating ROCE.
In Conclusion...
In the end, the trend of lower returns on the same amount of capital isn't typically an indication that we're looking at a growth stock. It should come as no surprise then that the stock has fallen 17% over the last five years, so it looks like investors are recognizing these changes. Unless there is a shift to a more positive trajectory in these metrics, we would look elsewhere.
If you'd like to know more about Feerum, we've spotted 2 warning signs, and 1 of them doesn't sit too well with us.
While Feerum isn't earning the highest return, check out this free list of companies that are earning high returns on equity with solid balance sheets.
New: AI Stock Screener & Alerts
Our new AI Stock Screener scans the market every day to uncover opportunities.
• Dividend Powerhouses (3%+ Yield)
• Undervalued Small Caps with Insider Buying
• High growth Tech and AI Companies
Or build your own from over 50 metrics.
Have feedback on this article? Concerned about the content? Get in touch with us directly. Alternatively, email editorial-team (at) simplywallst.com.
This article by Simply Wall St is general in nature. We provide commentary based on historical data and analyst forecasts only using an unbiased methodology and our articles are not intended to be financial advice. It does not constitute a recommendation to buy or sell any stock, and does not take account of your objectives, or your financial situation. We aim to bring you long-term focused analysis driven by fundamental data. Note that our analysis may not factor in the latest price-sensitive company announcements or qualitative material. Simply Wall St has no position in any stocks mentioned.
About WSE:FEE
Feerum
Engages in the designing and building of various drying and storage facilities.
Excellent balance sheet with limited growth.
Market Insights

Advertisement
Community Narratives
MicroVision will explode future revenue by 380.37% with a vision towards success
Fair Value US$60.00|98.4% undervalued
TH
Community Contributor
The Indispensable Artery for a New North American Economy
Fair Value CA$132.87|1.3% undervalued
TI
Community Contributor