Stock Analysis
- New Zealand
- /
- Electric Utilities
- /
- NZSE:MCY
Investing in Mercury NZ (NZSE:MCY) five years ago would have delivered you a 105% gain


Generally speaking the aim of active stock picking is to find companies that provide returns that are superior to the market average. And while active stock picking involves risks (and requires diversification) it can also provide excess returns. For example, the Mercury NZ Limited (NZSE:MCY) share price is up 70% in the last 5 years, clearly besting the market decline of around 4.5% (ignoring dividends). On the other hand, the more recent gains haven't been so impressive, with shareholders gaining just 9.2% , including dividends .
So let's assess the underlying fundamentals over the last 5 years and see if they've moved in lock-step with shareholder returns.
Check out our latest analysis for Mercury NZ
While markets are a powerful pricing mechanism, share prices reflect investor sentiment, not just underlying business performance. One flawed but reasonable way to assess how sentiment around a company has changed is to compare the earnings per share (EPS) with the share price.
Mercury NZ's earnings per share are down 29% per year, despite strong share price performance over five years.
This means it's unlikely the market is judging the company based on earnings growth. Because earnings per share don't seem to match up with the share price, we'll take a look at other metrics instead.
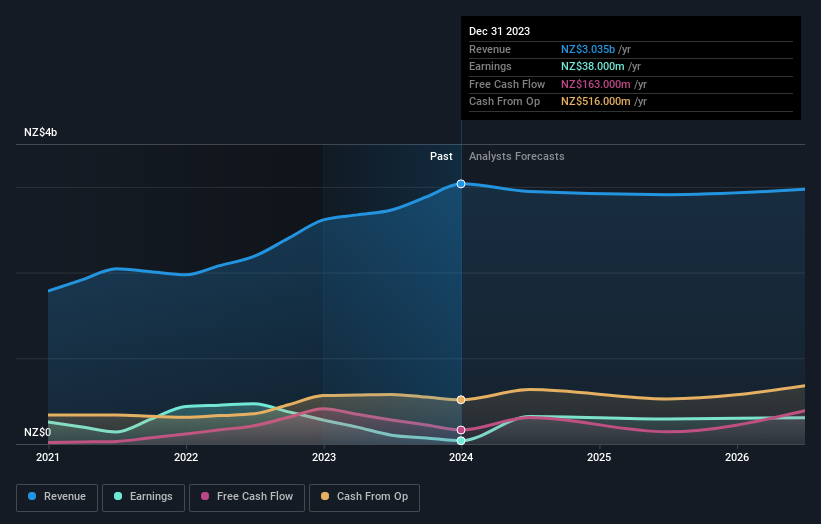
On the other hand, Mercury NZ's revenue is growing nicely, at a compound rate of 9.9% over the last five years. In that case, the company may be sacrificing current earnings per share to drive growth.
The image below shows how earnings and revenue have tracked over time (if you click on the image you can see greater detail).
If you are thinking of buying or selling Mercury NZ stock, you should check out this FREE detailed report on its balance sheet.
What About Dividends?
As well as measuring the share price return, investors should also consider the total shareholder return (TSR). Whereas the share price return only reflects the change in the share price, the TSR includes the value of dividends (assuming they were reinvested) and the benefit of any discounted capital raising or spin-off. So for companies that pay a generous dividend, the TSR is often a lot higher than the share price return. We note that for Mercury NZ the TSR over the last 5 years was 105%, which is better than the share price return mentioned above. The dividends paid by the company have thusly boosted the total shareholder return.
A Different Perspective
It's good to see that Mercury NZ has rewarded shareholders with a total shareholder return of 9.2% in the last twelve months. Of course, that includes the dividend. However, that falls short of the 15% TSR per annum it has made for shareholders, each year, over five years. Potential buyers might understandably feel they've missed the opportunity, but it's always possible business is still firing on all cylinders. It's always interesting to track share price performance over the longer term. But to understand Mercury NZ better, we need to consider many other factors. Like risks, for instance. Every company has them, and we've spotted 4 warning signs for Mercury NZ (of which 1 can't be ignored!) you should know about.
For those who like to find winning investments this free list of growing companies with recent insider purchasing, could be just the ticket.
Please note, the market returns quoted in this article reflect the market weighted average returns of stocks that currently trade on New Zealander exchanges.
Valuation is complex, but we're helping make it simple.
Find out whether Mercury NZ is potentially over or undervalued by checking out our comprehensive analysis, which includes fair value estimates, risks and warnings, dividends, insider transactions and financial health.
View the Free AnalysisHave feedback on this article? Concerned about the content? Get in touch with us directly. Alternatively, email editorial-team (at) simplywallst.com.
This article by Simply Wall St is general in nature. We provide commentary based on historical data and analyst forecasts only using an unbiased methodology and our articles are not intended to be financial advice. It does not constitute a recommendation to buy or sell any stock, and does not take account of your objectives, or your financial situation. We aim to bring you long-term focused analysis driven by fundamental data. Note that our analysis may not factor in the latest price-sensitive company announcements or qualitative material. Simply Wall St has no position in any stocks mentioned.
About NZSE:MCY
Mercury NZ
Mercury NZ Limited, together with its subsidiaries, engages in the production, trading, and sale of electricity and related activities in New Zealand.
Mediocre balance sheet and slightly overvalued.
