
Advertisement

To avoid investing in a business that's in decline, there's a few financial metrics that can provide early indications of aging. Businesses in decline often have two underlying trends, firstly, a declining return on capital employed (ROCE) and a declining base of capital employed. Trends like this ultimately mean the business is reducing its investments and also earning less on what it has invested. So after we looked into Vital (NZSE:VTL), the trends above didn't look too great.
Understanding Return On Capital Employed (ROCE)
Just to clarify if you're unsure, ROCE is a metric for evaluating how much pre-tax income (in percentage terms) a company earns on the capital invested in its business. To calculate this metric for Vital, this is the formula:
Return on Capital Employed = Earnings Before Interest and Tax (EBIT) ÷ (Total Assets - Current Liabilities)
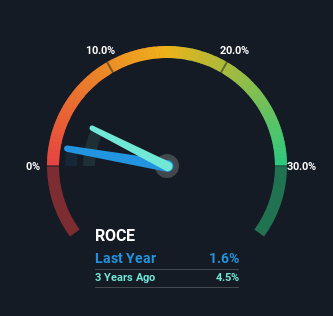
0.016 = NZ$920k ÷ (NZ$68m - NZ$12m) (Based on the trailing twelve months to June 2023).
Therefore, Vital has an ROCE of 1.6%. Ultimately, that's a low return and it under-performs the Wireless Telecom industry average of 9.9%.
Check out our latest analysis for Vital
While the past is not representative of the future, it can be helpful to know how a company has performed historically, which is why we have this chart above. If you're interested in investigating Vital's past further, check out this free graph of past earnings, revenue and cash flow.
The Trend Of ROCE
In terms of Vital's historical ROCE movements, the trend doesn't inspire confidence. Unfortunately the returns on capital have diminished from the 15% that they were earning five years ago. Meanwhile, capital employed in the business has stayed roughly the flat over the period. Companies that exhibit these attributes tend to not be shrinking, but they can be mature and facing pressure on their margins from competition. If these trends continue, we wouldn't expect Vital to turn into a multi-bagger.
The Key Takeaway
In the end, the trend of lower returns on the same amount of capital isn't typically an indication that we're looking at a growth stock. We expect this has contributed to the stock plummeting 72% during the last five years. With underlying trends that aren't great in these areas, we'd consider looking elsewhere.
One more thing to note, we've identified 3 warning signs with Vital and understanding these should be part of your investment process.
For those who like to invest in solid companies, check out this free list of companies with solid balance sheets and high returns on equity.
New: Manage All Your Stock Portfolios in One Place
We've created the ultimate portfolio companion for stock investors, and it's free.
• Connect an unlimited number of Portfolios and see your total in one currency
• Be alerted to new Warning Signs or Risks via email or mobile
• Track the Fair Value of your stocks
Have feedback on this article? Concerned about the content? Get in touch with us directly. Alternatively, email editorial-team (at) simplywallst.com.
This article by Simply Wall St is general in nature. We provide commentary based on historical data and analyst forecasts only using an unbiased methodology and our articles are not intended to be financial advice. It does not constitute a recommendation to buy or sell any stock, and does not take account of your objectives, or your financial situation. We aim to bring you long-term focused analysis driven by fundamental data. Note that our analysis may not factor in the latest price-sensitive company announcements or qualitative material. Simply Wall St has no position in any stocks mentioned.
About NZSE:VTL
Vital
Provides mobile radio networks and high-speed broadband services in New Zealand.
Good value low.
Market Insights

Advertisement
Community Narratives
Vita Life Sciences Set for a 12.72% Revenue Growth While Tackling Operational Challenges
Fair Value AU$2.42|8.7% undervalued
RO
Community Contributor
Vossloh rides a €500 billion wave to boost growth and earnings in the next decade
Fair Value €78.41|6.3% undervalued
CH
Community Contributor
Intuitive Surgical Will Transform Healthcare with 12% Revenue Growth
Fair Value US$325.55|56.5% overvalued
UN
Community Contributor