
Advertisement
- New Zealand
- /
- Telecom Services and Carriers
- /
- NZSE:SPK
Spark New Zealand's (NZSE:SPK) Earnings Are Weaker Than They Seem
Investors were disappointed with Spark New Zealand Limited's (NZSE:SPK) earnings, despite the strong profit numbers. We think that the market might be paying attention to some underlying factors are concerning.
Check out our latest analysis for Spark New Zealand
A Closer Look At Spark New Zealand's Earnings
In high finance, the key ratio used to measure how well a company converts reported profits into free cash flow (FCF) is the accrual ratio (from cashflow). The accrual ratio subtracts the FCF from the profit for a given period, and divides the result by the average operating assets of the company over that time. The ratio shows us how much a company's profit exceeds its FCF.
As a result, a negative accrual ratio is a positive for the company, and a positive accrual ratio is a negative. While having an accrual ratio above zero is of little concern, we do think it's worth noting when a company has a relatively high accrual ratio. That's because some academic studies have suggested that high accruals ratios tend to lead to lower profit or less profit growth.
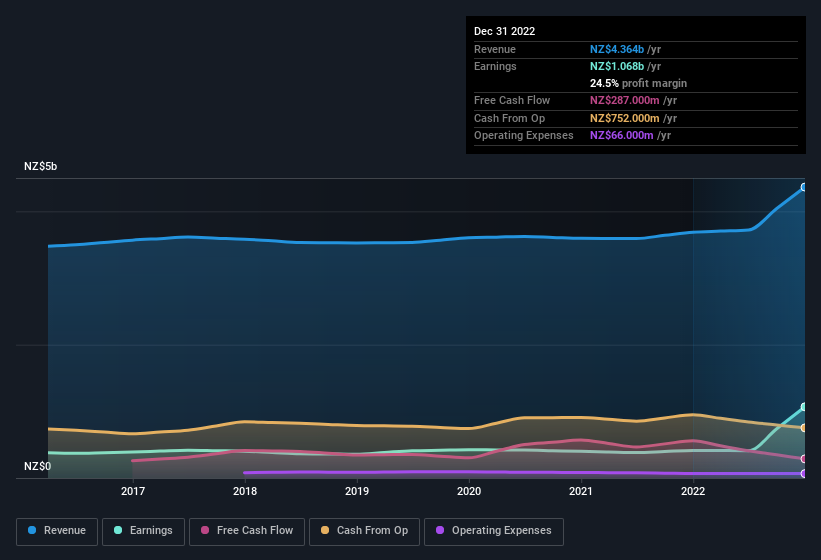
Over the twelve months to December 2022, Spark New Zealand recorded an accrual ratio of 0.27. We can therefore deduce that its free cash flow fell well short of covering its statutory profit. In fact, it had free cash flow of NZ$287m in the last year, which was a lot less than its statutory profit of NZ$1.07b. Spark New Zealand shareholders will no doubt be hoping that its free cash flow bounces back next year, since it was down over the last twelve months. One positive for Spark New Zealand shareholders is that it's accrual ratio was significantly better last year, providing reason to believe that it may return to stronger cash conversion in the future. Shareholders should look for improved cashflow relative to profit in the current year, if that is indeed the case.
That might leave you wondering what analysts are forecasting in terms of future profitability. Luckily, you can click here to see an interactive graph depicting future profitability, based on their estimates.
Our Take On Spark New Zealand's Profit Performance
Spark New Zealand didn't convert much of its profit to free cash flow in the last year, which some investors may consider rather suboptimal. Therefore, it seems possible to us that Spark New Zealand's true underlying earnings power is actually less than its statutory profit. But the good news is that its EPS growth over the last three years has been very impressive. The goal of this article has been to assess how well we can rely on the statutory earnings to reflect the company's potential, but there is plenty more to consider. So if you'd like to dive deeper into this stock, it's crucial to consider any risks it's facing. Our analysis shows 3 warning signs for Spark New Zealand (2 are a bit unpleasant!) and we strongly recommend you look at them before investing.
This note has only looked at a single factor that sheds light on the nature of Spark New Zealand's profit. But there are plenty of other ways to inform your opinion of a company. For example, many people consider a high return on equity as an indication of favorable business economics, while others like to 'follow the money' and search out stocks that insiders are buying. So you may wish to see this free collection of companies boasting high return on equity, or this list of stocks that insiders are buying.
New: Manage All Your Stock Portfolios in One Place
We've created the ultimate portfolio companion for stock investors, and it's free.
• Connect an unlimited number of Portfolios and see your total in one currency
• Be alerted to new Warning Signs or Risks via email or mobile
• Track the Fair Value of your stocks
Have feedback on this article? Concerned about the content? Get in touch with us directly. Alternatively, email editorial-team (at) simplywallst.com.
This article by Simply Wall St is general in nature. We provide commentary based on historical data and analyst forecasts only using an unbiased methodology and our articles are not intended to be financial advice. It does not constitute a recommendation to buy or sell any stock, and does not take account of your objectives, or your financial situation. We aim to bring you long-term focused analysis driven by fundamental data. Note that our analysis may not factor in the latest price-sensitive company announcements or qualitative material. Simply Wall St has no position in any stocks mentioned.
About NZSE:SPK
Spark New Zealand
Provides telecommunications and digital services in New Zealand.
Adequate balance sheet average dividend payer.
Similar Companies
Market Insights

Advertisement
Community Narratives
MicroVision will explode future revenue by 380.37% with a vision towards success
Fair Value US$60.00|98.4% undervalued
TH
Community Contributor
The Indispensable Artery for a New North American Economy
Fair Value CA$132.87|1.3% undervalued
TI
Community Contributor