Stock Analysis
- New Zealand
- /
- Telecom Services and Carriers
- /
- NZSE:SPK
Shareholders 14% loss in Spark New Zealand (NZSE:SPK) partly attributable to the company's decline in earnings over past year


Investors can approximate the average market return by buying an index fund. But if you buy individual stocks, you can do both better or worse than that. That downside risk was realized by Spark New Zealand Limited (NZSE:SPK) shareholders over the last year, as the share price declined 19%. That's disappointing when you consider the market declined 0.02%. At least the damage isn't so bad if you look at the last three years, since the stock is down 14% in that time. Furthermore, it's down 14% in about a quarter. That's not much fun for holders.
The recent uptick of 3.0% could be a positive sign of things to come, so let's take a look at historical fundamentals.
View our latest analysis for Spark New Zealand
To quote Buffett, 'Ships will sail around the world but the Flat Earth Society will flourish. There will continue to be wide discrepancies between price and value in the marketplace...' One way to examine how market sentiment has changed over time is to look at the interaction between a company's share price and its earnings per share (EPS).
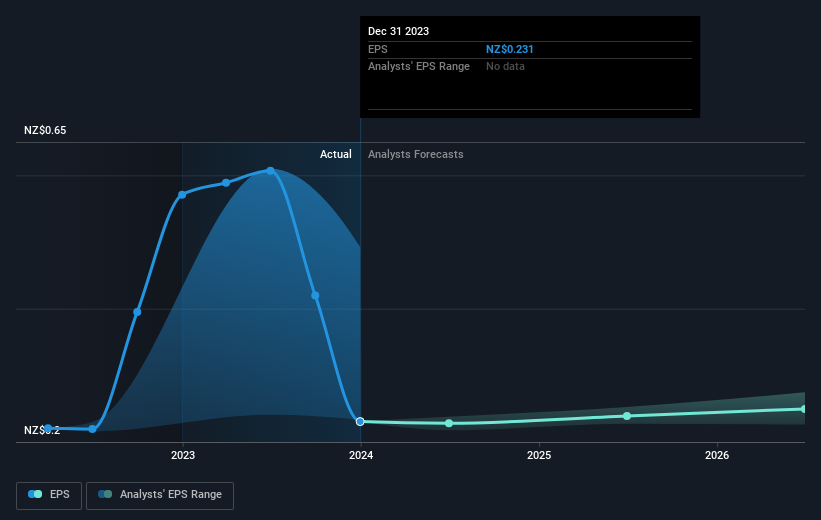
Unhappily, Spark New Zealand had to report a 60% decline in EPS over the last year. This fall in the EPS is significantly worse than the 19% the share price fall. So the market may not be too worried about the EPS figure, at the moment -- or it may have expected earnings to drop faster.
You can see how EPS has changed over time in the image below (click on the chart to see the exact values).
Before buying or selling a stock, we always recommend a close examination of historic growth trends, available here.
What About Dividends?
When looking at investment returns, it is important to consider the difference between total shareholder return (TSR) and share price return. The TSR incorporates the value of any spin-offs or discounted capital raisings, along with any dividends, based on the assumption that the dividends are reinvested. So for companies that pay a generous dividend, the TSR is often a lot higher than the share price return. We note that for Spark New Zealand the TSR over the last 1 year was -14%, which is better than the share price return mentioned above. And there's no prize for guessing that the dividend payments largely explain the divergence!
A Different Perspective
While the broader market lost about 0.02% in the twelve months, Spark New Zealand shareholders did even worse, losing 14% (even including dividends). Having said that, it's inevitable that some stocks will be oversold in a falling market. The key is to keep your eyes on the fundamental developments. On the bright side, long term shareholders have made money, with a gain of 7% per year over half a decade. If the fundamental data continues to indicate long term sustainable growth, the current sell-off could be an opportunity worth considering. I find it very interesting to look at share price over the long term as a proxy for business performance. But to truly gain insight, we need to consider other information, too. To that end, you should learn about the 3 warning signs we've spotted with Spark New Zealand (including 1 which is concerning) .
If you are like me, then you will not want to miss this free list of undervalued small caps that insiders are buying.
Please note, the market returns quoted in this article reflect the market weighted average returns of stocks that currently trade on New Zealander exchanges.
Valuation is complex, but we're helping make it simple.
Find out whether Spark New Zealand is potentially over or undervalued by checking out our comprehensive analysis, which includes fair value estimates, risks and warnings, dividends, insider transactions and financial health.
View the Free AnalysisHave feedback on this article? Concerned about the content? Get in touch with us directly. Alternatively, email editorial-team (at) simplywallst.com.
This article by Simply Wall St is general in nature. We provide commentary based on historical data and analyst forecasts only using an unbiased methodology and our articles are not intended to be financial advice. It does not constitute a recommendation to buy or sell any stock, and does not take account of your objectives, or your financial situation. We aim to bring you long-term focused analysis driven by fundamental data. Note that our analysis may not factor in the latest price-sensitive company announcements or qualitative material. Simply Wall St has no position in any stocks mentioned.
Valuation is complex, but we're helping make it simple.
Find out whether Spark New Zealand is potentially over or undervalued by checking out our comprehensive analysis, which includes fair value estimates, risks and warnings, dividends, insider transactions and financial health.
View the Free AnalysisHave feedback on this article? Concerned about the content? Get in touch with us directly. Alternatively, email editorial-team@simplywallst.com
About NZSE:SPK
Spark New Zealand
Provides telecommunications and digital services in New Zealand.
Adequate balance sheet and fair value.
