
Advertisement
- New Zealand
- /
- Software
- /
- NZSE:ENS
Are Enprise Group Limited's (NZSE:ENS) Fundamentals Good Enough to Warrant Buying Given The Stock's Recent Weakness?
With its stock down 14% over the past three months, it is easy to disregard Enprise Group (NZSE:ENS). However, stock prices are usually driven by a company’s financials over the long term, which in this case look pretty respectable. In this article, we decided to focus on Enprise Group's ROE.
Return on equity or ROE is a key measure used to assess how efficiently a company's management is utilizing the company's capital. Put another way, it reveals the company's success at turning shareholder investments into profits.
How Is ROE Calculated?
The formula for return on equity is:
Return on Equity = Net Profit (from continuing operations) ÷ Shareholders' Equity
So, based on the above formula, the ROE for Enprise Group is:
29% = NZ$1.0m ÷ NZ$3.4m (Based on the trailing twelve months to December 2024).
The 'return' is the profit over the last twelve months. That means that for every NZ$1 worth of shareholders' equity, the company generated NZ$0.29 in profit.
View our latest analysis for Enprise Group
What Is The Relationship Between ROE And Earnings Growth?
Thus far, we have learned that ROE measures how efficiently a company is generating its profits. Based on how much of its profits the company chooses to reinvest or "retain", we are then able to evaluate a company's future ability to generate profits. Assuming all else is equal, companies that have both a higher return on equity and higher profit retention are usually the ones that have a higher growth rate when compared to companies that don't have the same features.
A Side By Side comparison of Enprise Group's Earnings Growth And 29% ROE
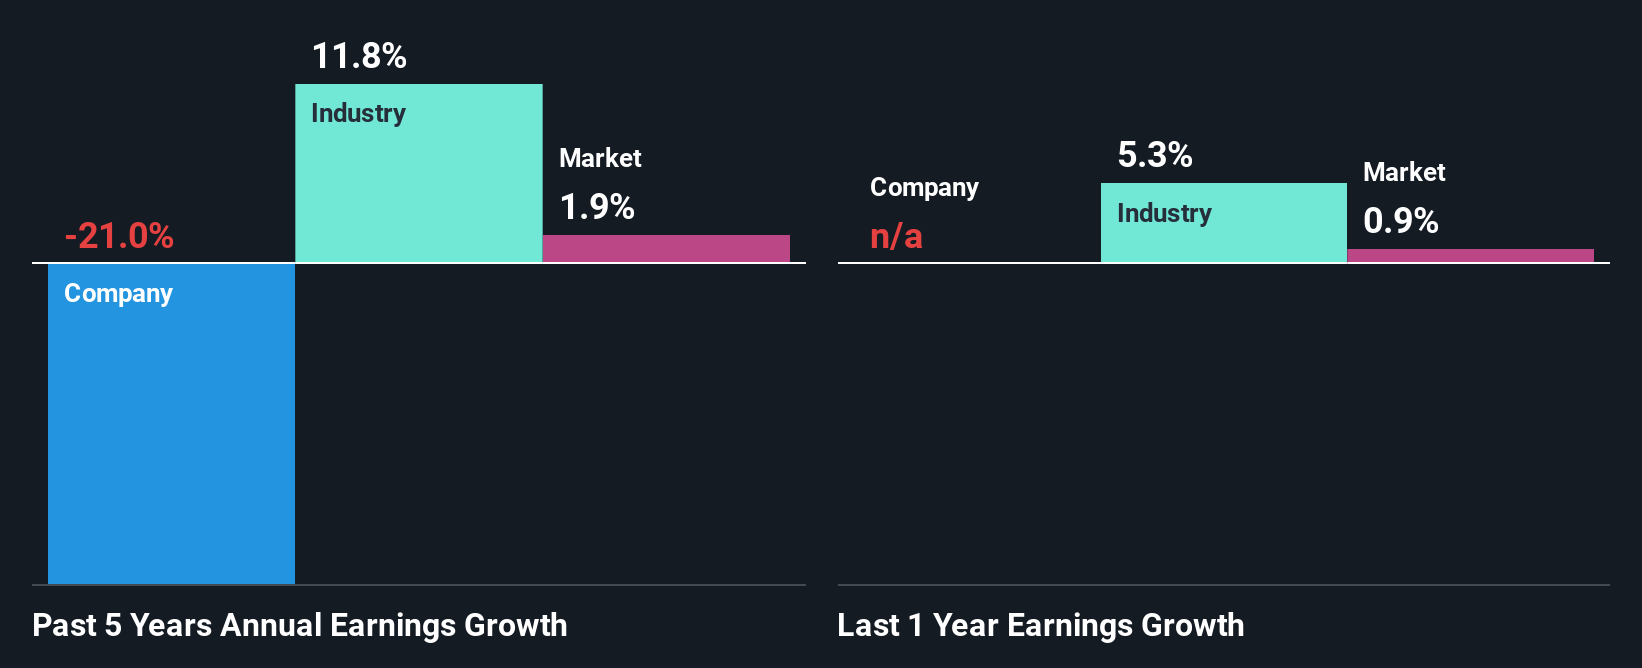
Firstly, we acknowledge that Enprise Group has a significantly high ROE. Secondly, even when compared to the industry average of 12% the company's ROE is quite impressive. Needless to say, we are quite surprised to see that Enprise Group's net income shrunk at a rate of 21% over the past five years. So, there might be some other aspects that could explain this. These include low earnings retention or poor allocation of capital.
However, when we compared Enprise Group's growth with the industry we found that while the company's earnings have been shrinking, the industry has seen an earnings growth of 12% in the same period. This is quite worrisome.
The basis for attaching value to a company is, to a great extent, tied to its earnings growth. The investor should try to establish if the expected growth or decline in earnings, whichever the case may be, is priced in. Doing so will help them establish if the stock's future looks promising or ominous. Is Enprise Group fairly valued compared to other companies? These 3 valuation measures might help you decide.
Is Enprise Group Using Its Retained Earnings Effectively?
Because Enprise Group doesn't pay any regular dividends, we infer that it is retaining all of its profits, which is rather perplexing when you consider the fact that there is no earnings growth to show for it. So there might be other factors at play here which could potentially be hampering growth. For example, the business has faced some headwinds.
Summary
In total, it does look like Enprise Group has some positive aspects to its business. However, given the high ROE and high profit retention, we would expect the company to be delivering strong earnings growth, but that isn't the case here. This suggests that there might be some external threat to the business, that's hampering its growth. While we won't completely dismiss the company, what we would do, is try to ascertain how risky the business is to make a more informed decision around the company. Our risks dashboard would have the 2 risks we have identified for Enprise Group.
Valuation is complex, but we're here to simplify it.
Discover if Enprise Group might be undervalued or overvalued with our detailed analysis, featuring fair value estimates, potential risks, dividends, insider trades, and its financial condition.
Access Free AnalysisHave feedback on this article? Concerned about the content? Get in touch with us directly. Alternatively, email editorial-team (at) simplywallst.com.
This article by Simply Wall St is general in nature. We provide commentary based on historical data and analyst forecasts only using an unbiased methodology and our articles are not intended to be financial advice. It does not constitute a recommendation to buy or sell any stock, and does not take account of your objectives, or your financial situation. We aim to bring you long-term focused analysis driven by fundamental data. Note that our analysis may not factor in the latest price-sensitive company announcements or qualitative material. Simply Wall St has no position in any stocks mentioned.
About NZSE:ENS
Enprise Group
Operates as a high-tech software and services investment company worldwide.
Adequate balance sheet with low risk.
Market Insights

Advertisement
Community Narratives
MINISO's fair value is projected at 26.69 with an anticipated PE ratio shift of 20x
Fair Value US$24.03|9.0% undervalued
BE
Community Contributor
Procter & Gamble: A Dividend Giant Facing Slowing Growth
Fair Value US$119.81|23.5% overvalued
AN
Community Contributor
Eli Lilly's Future Growth Driven by Tirzepatide and Favorable Market Conditions
Fair Value US$1.19k|14.4% undervalued
EA
Community Contributor