- New Zealand
- /
- Specialty Stores
- /
- NZSE:TRA
Turners Automotive Group's (NZSE:TRA) 22% CAGR outpaced the company's earnings growth over the same five-year period

Generally speaking the aim of active stock picking is to find companies that provide returns that are superior to the market average. And in our experience, buying the right stocks can give your wealth a significant boost. For example, the Turners Automotive Group Limited (NZSE:TRA) share price is up 86% in the last 5 years, clearly besting the market decline of around 0.5% (ignoring dividends). On the other hand, the more recent gains haven't been so impressive, with shareholders gaining just 42% , including dividends .
Since it's been a strong week for Turners Automotive Group shareholders, let's have a look at trend of the longer term fundamentals.
See our latest analysis for Turners Automotive Group
There is no denying that markets are sometimes efficient, but prices do not always reflect underlying business performance. One flawed but reasonable way to assess how sentiment around a company has changed is to compare the earnings per share (EPS) with the share price.
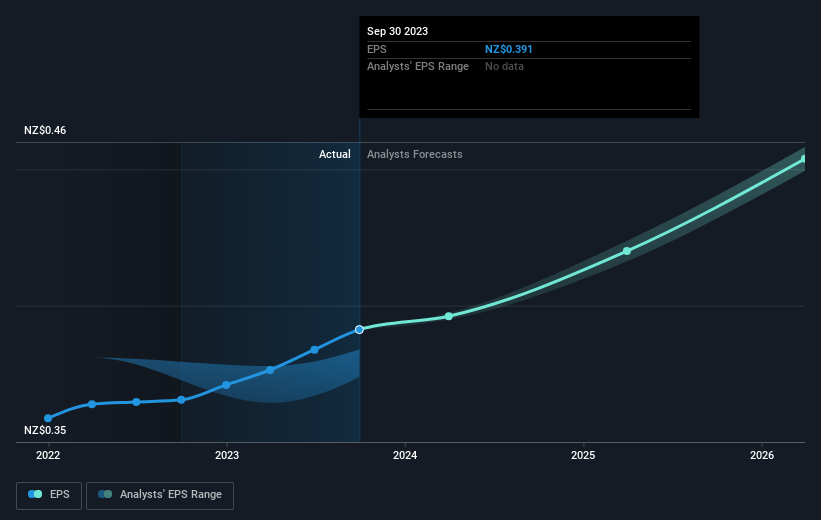
During five years of share price growth, Turners Automotive Group achieved compound earnings per share (EPS) growth of 4.6% per year. This EPS growth is lower than the 13% average annual increase in the share price. This suggests that market participants hold the company in higher regard, these days. That's not necessarily surprising considering the five-year track record of earnings growth.
The company's earnings per share (over time) is depicted in the image below (click to see the exact numbers).
It might be well worthwhile taking a look at our free report on Turners Automotive Group's earnings, revenue and cash flow.
What About Dividends?
As well as measuring the share price return, investors should also consider the total shareholder return (TSR). Whereas the share price return only reflects the change in the share price, the TSR includes the value of dividends (assuming they were reinvested) and the benefit of any discounted capital raising or spin-off. Arguably, the TSR gives a more comprehensive picture of the return generated by a stock. As it happens, Turners Automotive Group's TSR for the last 5 years was 168%, which exceeds the share price return mentioned earlier. And there's no prize for guessing that the dividend payments largely explain the divergence!
A Different Perspective
We're pleased to report that Turners Automotive Group shareholders have received a total shareholder return of 42% over one year. And that does include the dividend. That gain is better than the annual TSR over five years, which is 22%. Therefore it seems like sentiment around the company has been positive lately. Someone with an optimistic perspective could view the recent improvement in TSR as indicating that the business itself is getting better with time. I find it very interesting to look at share price over the long term as a proxy for business performance. But to truly gain insight, we need to consider other information, too. For instance, we've identified 2 warning signs for Turners Automotive Group (1 can't be ignored) that you should be aware of.
For those who like to find winning investments this free list of growing companies with recent insider purchasing, could be just the ticket.
Please note, the market returns quoted in this article reflect the market weighted average returns of stocks that currently trade on New Zealander exchanges.
Valuation is complex, but we're here to simplify it.
Discover if Turners Automotive Group might be undervalued or overvalued with our detailed analysis, featuring fair value estimates, potential risks, dividends, insider trades, and its financial condition.
Access Free AnalysisHave feedback on this article? Concerned about the content? Get in touch with us directly. Alternatively, email editorial-team (at) simplywallst.com.
This article by Simply Wall St is general in nature. We provide commentary based on historical data and analyst forecasts only using an unbiased methodology and our articles are not intended to be financial advice. It does not constitute a recommendation to buy or sell any stock, and does not take account of your objectives, or your financial situation. We aim to bring you long-term focused analysis driven by fundamental data. Note that our analysis may not factor in the latest price-sensitive company announcements or qualitative material. Simply Wall St has no position in any stocks mentioned.
About NZSE:TRA
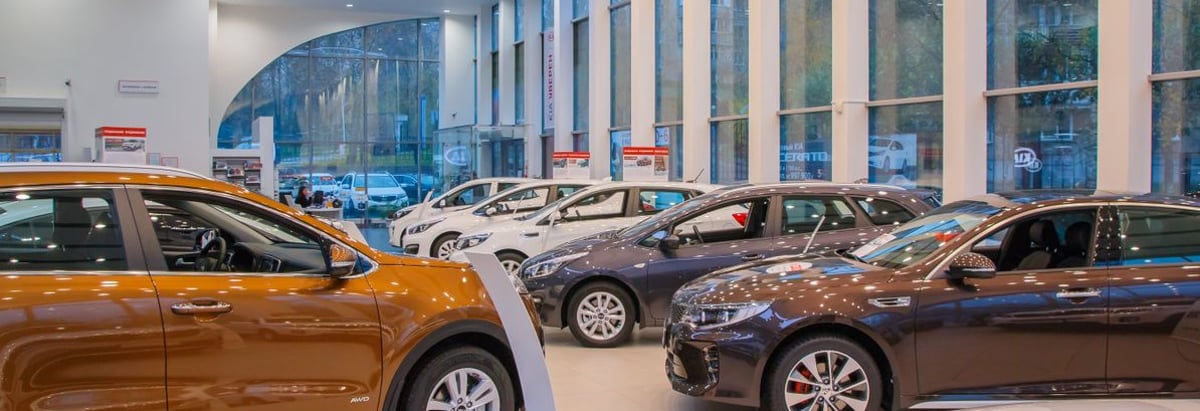
Turners Automotive Group
Engages in the automotive retail business in New Zealand and Australia.
Good value with acceptable track record.

