
Advertisement
- New Zealand
- /
- Specialty Stores
- /
- NZSE:2CC
Is 2 Cheap Cars Group Limited's (NZSE:2CC) Latest Stock Performance A Reflection Of Its Financial Health?
2 Cheap Cars Group's (NZSE:2CC) stock is up by a considerable 14% over the past month. Since the market usually pay for a company’s long-term fundamentals, we decided to study the company’s key performance indicators to see if they could be influencing the market. Specifically, we decided to study 2 Cheap Cars Group's ROE in this article.
Return on equity or ROE is a key measure used to assess how efficiently a company's management is utilizing the company's capital. Simply put, it is used to assess the profitability of a company in relation to its equity capital.
How Is ROE Calculated?
The formula for return on equity is:
Return on Equity = Net Profit (from continuing operations) ÷ Shareholders' Equity
So, based on the above formula, the ROE for 2 Cheap Cars Group is:
16% = NZ$3.3m ÷ NZ$21m (Based on the trailing twelve months to March 2025).
The 'return' is the yearly profit. Another way to think of that is that for every NZ$1 worth of equity, the company was able to earn NZ$0.16 in profit.
Check out our latest analysis for 2 Cheap Cars Group
What Has ROE Got To Do With Earnings Growth?
We have already established that ROE serves as an efficient profit-generating gauge for a company's future earnings. We now need to evaluate how much profit the company reinvests or "retains" for future growth which then gives us an idea about the growth potential of the company. Assuming all else is equal, companies that have both a higher return on equity and higher profit retention are usually the ones that have a higher growth rate when compared to companies that don't have the same features.
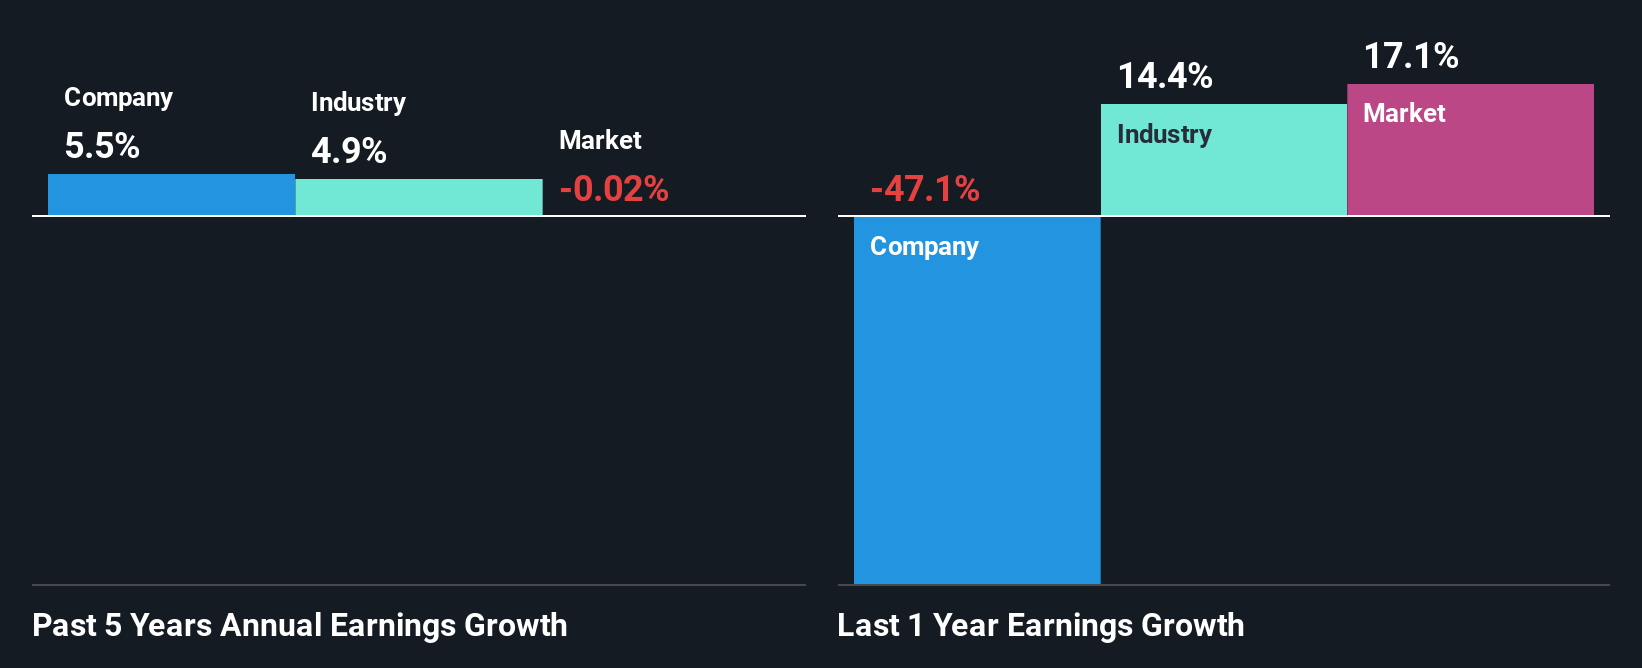
A Side By Side comparison of 2 Cheap Cars Group's Earnings Growth And 16% ROE
To begin with, 2 Cheap Cars Group seems to have a respectable ROE. Further, the company's ROE is similar to the industry average of 16%. Consequently, this likely laid the ground for the decent growth of 5.5% seen over the past five years by 2 Cheap Cars Group.
As a next step, we compared 2 Cheap Cars Group's net income growth with the industry and found that the company has a similar growth figure when compared with the industry average growth rate of 4.9% in the same period.
The basis for attaching value to a company is, to a great extent, tied to its earnings growth. It’s important for an investor to know whether the market has priced in the company's expected earnings growth (or decline). Doing so will help them establish if the stock's future looks promising or ominous. If you're wondering about 2 Cheap Cars Group's's valuation, check out this gauge of its price-to-earnings ratio, as compared to its industry.
Is 2 Cheap Cars Group Efficiently Re-investing Its Profits?
The high three-year median payout ratio of 59% (or a retention ratio of 41%) for 2 Cheap Cars Group suggests that the company's growth wasn't really hampered despite it returning most of its income to its shareholders.
Moreover, 2 Cheap Cars Group is determined to keep sharing its profits with shareholders which we infer from its long history of four years of paying a dividend.
Conclusion
Overall, we are quite pleased with 2 Cheap Cars Group's performance. We are particularly impressed by the considerable earnings growth posted by the company, which was likely backed by its high ROE. While the company is paying out most of its earnings as dividends, it has been able to grow its earnings in spite of it, so that's probably a good sign. Until now, we have only just grazed the surface of the company's past performance by looking at the company's fundamentals. To gain further insights into 2 Cheap Cars Group's past profit growth, check out this visualization of past earnings, revenue and cash flows.
New: Manage All Your Stock Portfolios in One Place
We've created the ultimate portfolio companion for stock investors, and it's free.
• Connect an unlimited number of Portfolios and see your total in one currency
• Be alerted to new Warning Signs or Risks via email or mobile
• Track the Fair Value of your stocks
Have feedback on this article? Concerned about the content? Get in touch with us directly. Alternatively, email editorial-team (at) simplywallst.com.
This article by Simply Wall St is general in nature. We provide commentary based on historical data and analyst forecasts only using an unbiased methodology and our articles are not intended to be financial advice. It does not constitute a recommendation to buy or sell any stock, and does not take account of your objectives, or your financial situation. We aim to bring you long-term focused analysis driven by fundamental data. Note that our analysis may not factor in the latest price-sensitive company announcements or qualitative material. Simply Wall St has no position in any stocks mentioned.
About NZSE:2CC
2 Cheap Cars Group
Engages in used automotive vehicle retail and vehicle finance businesses in New Zealand.
Flawless balance sheet, good value and pays a dividend.
Market Insights

Advertisement
Community Narratives
Finding The True Value Of A Logistics Powerhouse
Fair Value US$95.21|6.3% undervalued
NV
Community Contributor
Paradigm Biopharmaceuticals Will Lead Osteoarthritis Treatment with Zilosul's FDA Success
Fair Value AU$5.50|91.9% undervalued
AM
Community Contributor
Barrick Mining (ABX:CA): A Gold Hedge against a U.S. Shutdown
Fair Value CA$60.00|25.8% undervalued
GM
Community Contributor