
Advertisement
- New Zealand
- /
- REITS
- /
- NZSE:SPG
Did You Participate In Any Of Stride Stapled Group's (NZSE:SPG) Respectable 62% Return?
One simple way to benefit from the stock market is to buy an index fund. But if you buy good businesses at attractive prices, your portfolio returns could exceed the average market return. For example, Stride Stapled Group (NZSE:SPG) shareholders have seen the share price rise 37% over three years, well in excess of the market return (30%, not including dividends). However, more recent returns haven't been as impressive as that, with the stock returning just 11% in the last year , including dividends .
View our latest analysis for Stride Stapled Group
In his essay The Superinvestors of Graham-and-Doddsville Warren Buffett described how share prices do not always rationally reflect the value of a business. One flawed but reasonable way to assess how sentiment around a company has changed is to compare the earnings per share (EPS) with the share price.
During the three years of share price growth, Stride Stapled Group actually saw its earnings per share (EPS) drop 22% per year.
Thus, it seems unlikely that the market is focussed on EPS growth at the moment. Therefore, we think it's worth considering other metrics as well.
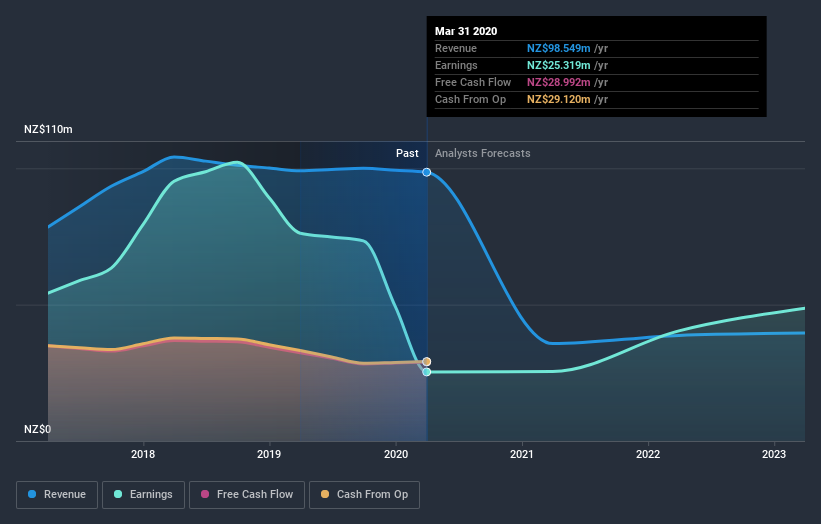
We doubt the dividend payments explain the share price rise, since we don't see any improvement in that regard. But it's far more plausible that the revenue growth of 4.6% per year is viewed as evidence that Stride Stapled Group is growing. It could be that investors are content with the revenue growth on the basis that the company isn't really focussed on profits just yet. And that might explain the higher price.
You can see how earnings and revenue have changed over time in the image below (click on the chart to see the exact values).
Balance sheet strength is crucial. It might be well worthwhile taking a look at our free report on how its financial position has changed over time.
What About Dividends?
As well as measuring the share price return, investors should also consider the total shareholder return (TSR). The TSR is a return calculation that accounts for the value of cash dividends (assuming that any dividend received was reinvested) and the calculated value of any discounted capital raisings and spin-offs. Arguably, the TSR gives a more comprehensive picture of the return generated by a stock. In the case of Stride Stapled Group, it has a TSR of 62% for the last 3 years. That exceeds its share price return that we previously mentioned. The dividends paid by the company have thusly boosted the total shareholder return.
A Different Perspective
Stride Stapled Group shareholders are up 11% for the year (even including dividends). It's always nice to make money but this return falls short of the market return which was about 14% for the year. But the (superior) three-year TSR of 17% per year is some consolation. We prefer focus on longer term returns, as they are usually a more meaningful indication of the underlying business. While it is well worth considering the different impacts that market conditions can have on the share price, there are other factors that are even more important. Like risks, for instance. Every company has them, and we've spotted 3 warning signs for Stride Stapled Group (of which 1 shouldn't be ignored!) you should know about.
Of course, you might find a fantastic investment by looking elsewhere. So take a peek at this free list of companies we expect will grow earnings.
Please note, the market returns quoted in this article reflect the market weighted average returns of stocks that currently trade on NZ exchanges.
If you decide to trade Stride Stapled Group, use the lowest-cost* platform that is rated #1 Overall by Barron’s, Interactive Brokers. Trade stocks, options, futures, forex, bonds and funds on 135 markets, all from a single integrated account. Promoted
New: Manage All Your Stock Portfolios in One Place
We've created the ultimate portfolio companion for stock investors, and it's free.
• Connect an unlimited number of Portfolios and see your total in one currency
• Be alerted to new Warning Signs or Risks via email or mobile
• Track the Fair Value of your stocks
This article by Simply Wall St is general in nature. It does not constitute a recommendation to buy or sell any stock, and does not take account of your objectives, or your financial situation. We aim to bring you long-term focused analysis driven by fundamental data. Note that our analysis may not factor in the latest price-sensitive company announcements or qualitative material. Simply Wall St has no position in any stocks mentioned.
*Interactive Brokers Rated Lowest Cost Broker by StockBrokers.com Annual Online Review 2020
Have feedback on this article? Concerned about the content? Get in touch with us directly. Alternatively, email editorial-team@simplywallst.com.
About NZSE:SPG
Stride Property Group
Stride Stapled Group is a real estate investment firm specializing in co-investments and investments in commercial, retail, and industrial real estate properties.
Adequate balance sheet and slightly overvalued.
Similar Companies
Market Insights

Advertisement
Community Narratives
MINISO's fair value is projected at 26.69 with an anticipated PE ratio shift of 20x
Fair Value US$24.03|11.0% undervalued
BE
Community Contributor
Procter & Gamble: A Dividend Giant Facing Slowing Growth
Fair Value US$119.81|23.3% overvalued
AN
Community Contributor
Eli Lilly's Future Growth Driven by Tirzepatide and Favorable Market Conditions
Fair Value US$1.19k|13.8% undervalued
EA
Community Contributor