
Advertisement
- New Zealand
- /
- Healthcare Services
- /
- NZSE:EBO
Shareholders May Be More Conservative With EBOS Group Limited's (NZSE:EBO) CEO Compensation For Now
Key Insights
- EBOS Group to hold its Annual General Meeting on 23rd of October
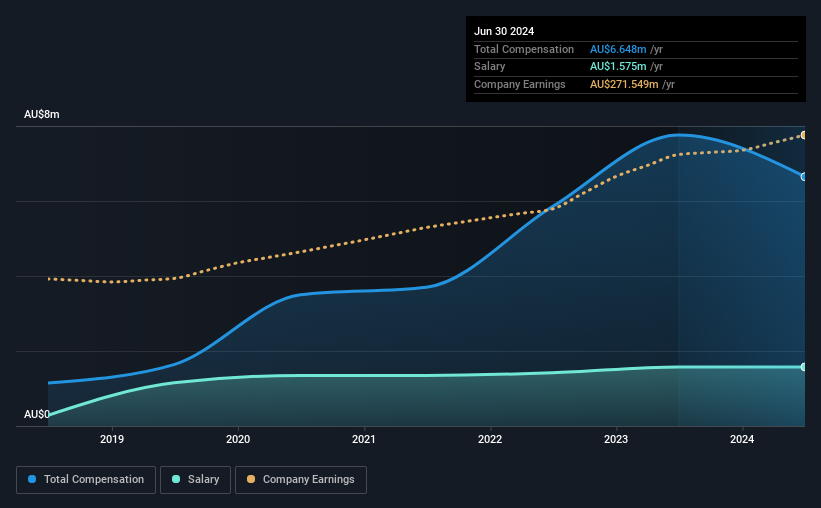
- Total pay for CEO John Cullity includes AU$1.57m salary
- The total compensation is 51% higher than the average for the industry
- EBOS Group's EPS grew by 7.2% over the past three years while total shareholder return over the past three years was 11%
CEO John Cullity has done a decent job of delivering relatively good performance at EBOS Group Limited (NZSE:EBO) recently. As shareholders go into the upcoming AGM on 23rd of October, CEO compensation will probably not be their focus, but rather the steps management will take to continue the growth momentum. However, some shareholders may still want to keep CEO compensation within reason.
Check out our latest analysis for EBOS Group
How Does Total Compensation For John Cullity Compare With Other Companies In The Industry?
Our data indicates that EBOS Group Limited has a market capitalization of NZ$7.0b, and total annual CEO compensation was reported as AU$6.6m for the year to June 2024. That's a notable decrease of 14% on last year. While we always look at total compensation first, our analysis shows that the salary component is less, at AU$1.6m.
For comparison, other companies in the New Zealander Healthcare industry with market capitalizations ranging between NZ$3.3b and NZ$11b had a median total CEO compensation of AU$4.4m. Accordingly, our analysis reveals that EBOS Group Limited pays John Cullity north of the industry median. Moreover, John Cullity also holds NZ$12m worth of EBOS Group stock directly under their own name, which reveals to us that they have a significant personal stake in the company.
| Component | 2024 | 2023 | Proportion (2024) |
| Salary | AU$1.6m | AU$1.6m | 24% |
| Other | AU$5.1m | AU$6.2m | 76% |
| Total Compensation | AU$6.6m | AU$7.8m | 100% |
On an industry level, roughly 55% of total compensation represents salary and 45% is other remuneration. It's interesting to note that EBOS Group allocates a smaller portion of compensation to salary in comparison to the broader industry. It's important to note that a slant towards non-salary compensation suggests that total pay is tied to the company's performance.
A Look at EBOS Group Limited's Growth Numbers
Over the past three years, EBOS Group Limited has seen its earnings per share (EPS) grow by 7.2% per year. In the last year, its revenue is up 7.8%.
We would argue that the improvement in revenue is good, but isn't particularly impressive, but we're happy with the modest EPS growth. Considering these factors we'd say performance has been pretty decent, though not amazing. Moving away from current form for a second, it could be important to check this free visual depiction of what analysts expect for the future.
Has EBOS Group Limited Been A Good Investment?
EBOS Group Limited has generated a total shareholder return of 11% over three years, so most shareholders would be reasonably content. But they would probably prefer not to see CEO compensation far in excess of the median.
To Conclude...
Seeing that the company has put up a decent performance, only a few shareholders, if any at all, might have questions about the CEO pay in the upcoming AGM. However, if the board proposes to increase the compensation, some shareholders might have questions given that the CEO is already being paid higher than the industry.
While CEO pay is an important factor to be aware of, there are other areas that investors should be mindful of as well. That's why we did some digging and identified 2 warning signs for EBOS Group that you should be aware of before investing.
Arguably, business quality is much more important than CEO compensation levels. So check out this free list of interesting companies that have HIGH return on equity and low debt.
Valuation is complex, but we're here to simplify it.
Discover if EBOS Group might be undervalued or overvalued with our detailed analysis, featuring fair value estimates, potential risks, dividends, insider trades, and its financial condition.
Access Free AnalysisHave feedback on this article? Concerned about the content? Get in touch with us directly. Alternatively, email editorial-team (at) simplywallst.com.
This article by Simply Wall St is general in nature. We provide commentary based on historical data and analyst forecasts only using an unbiased methodology and our articles are not intended to be financial advice. It does not constitute a recommendation to buy or sell any stock, and does not take account of your objectives, or your financial situation. We aim to bring you long-term focused analysis driven by fundamental data. Note that our analysis may not factor in the latest price-sensitive company announcements or qualitative material. Simply Wall St has no position in any stocks mentioned.
About NZSE:EBO
EBOS Group
Engages in the marketing, wholesale, and distribution of healthcare, medical, pharmaceutical, and animal care products in Australia, Southeast Asia, and New Zealand.
Flawless balance sheet average dividend payer.
Market Insights

Advertisement
Community Narratives
The company that turned a verb into a global necessity and basically runs the modern internet, digital ads, smartphones, maps, and AI.
Fair Value US$300.00|10.8% undervalued
OS
Community Contributor
Flowers Foods Pays A Fair Price For Health
Fair Value US$16.12|22.0% undervalued
NV
Community Contributor
TMX Group will thrive with 33.3% profit margin and enduring market moat
Fair Value CA$49.90|3.8% overvalued
LI
Community Contributor