
Advertisement
- New Zealand
- /
- Building
- /
- NZSE:MPG
Returns On Capital Signal Difficult Times Ahead For Metro Performance Glass (NZSE:MPG)
What underlying fundamental trends can indicate that a company might be in decline? A business that's potentially in decline often shows two trends, a return on capital employed (ROCE) that's declining, and a base of capital employed that's also declining. This reveals that the company isn't compounding shareholder wealth because returns are falling and its net asset base is shrinking. And from a first read, things don't look too good at Metro Performance Glass (NZSE:MPG), so let's see why.
Understanding Return On Capital Employed (ROCE)
For those who don't know, ROCE is a measure of a company's yearly pre-tax profit (its return), relative to the capital employed in the business. To calculate this metric for Metro Performance Glass, this is the formula:
Return on Capital Employed = Earnings Before Interest and Tax (EBIT) ÷ (Total Assets - Current Liabilities)
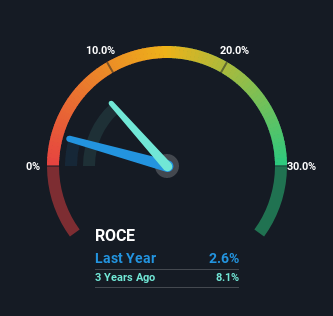
0.026 = NZ$6.2m ÷ (NZ$286m - NZ$47m) (Based on the trailing twelve months to September 2022).
So, Metro Performance Glass has an ROCE of 2.6%. Ultimately, that's a low return and it under-performs the Building industry average of 11%.
See our latest analysis for Metro Performance Glass
In the above chart we have measured Metro Performance Glass' prior ROCE against its prior performance, but the future is arguably more important. If you'd like, you can check out the forecasts from the analysts covering Metro Performance Glass here for free.
What Does the ROCE Trend For Metro Performance Glass Tell Us?
We are a bit worried about the trend of returns on capital at Metro Performance Glass. About five years ago, returns on capital were 13%, however they're now substantially lower than that as we saw above. On top of that, it's worth noting that the amount of capital employed within the business has remained relatively steady. This combination can be indicative of a mature business that still has areas to deploy capital, but the returns received aren't as high due potentially to new competition or smaller margins. If these trends continue, we wouldn't expect Metro Performance Glass to turn into a multi-bagger.
The Key Takeaway
All in all, the lower returns from the same amount of capital employed aren't exactly signs of a compounding machine. Unsurprisingly then, the stock has dived 80% over the last five years, so investors are recognizing these changes and don't like the company's prospects. With underlying trends that aren't great in these areas, we'd consider looking elsewhere.
One more thing to note, we've identified 2 warning signs with Metro Performance Glass and understanding these should be part of your investment process.
While Metro Performance Glass isn't earning the highest return, check out this free list of companies that are earning high returns on equity with solid balance sheets.
New: Manage All Your Stock Portfolios in One Place
We've created the ultimate portfolio companion for stock investors, and it's free.
• Connect an unlimited number of Portfolios and see your total in one currency
• Be alerted to new Warning Signs or Risks via email or mobile
• Track the Fair Value of your stocks
Have feedback on this article? Concerned about the content? Get in touch with us directly. Alternatively, email editorial-team (at) simplywallst.com.
This article by Simply Wall St is general in nature. We provide commentary based on historical data and analyst forecasts only using an unbiased methodology and our articles are not intended to be financial advice. It does not constitute a recommendation to buy or sell any stock, and does not take account of your objectives, or your financial situation. We aim to bring you long-term focused analysis driven by fundamental data. Note that our analysis may not factor in the latest price-sensitive company announcements or qualitative material. Simply Wall St has no position in any stocks mentioned.
About NZSE:MPG
Metro Performance Glass
Supplies processed flat glass and related products for the residential and commercial building sectors in New Zealand and Australia.
Adequate balance sheet with low risk.
Similar Companies
Market Insights

Advertisement
Community Narratives
MicroVision will explode future revenue by 380.37% with a vision towards success
Fair Value US$60|98.4% undervalued
TH
Community Contributor
The Indispensable Artery for a New North American Economy
Fair Value CA$132.87|0.7% overvalued
TI
Community Contributor
Recently Updated Narratives
CE

cementafriend on Constellation Energy ·
Constellation Energy Dividends and Growth
Fair Value:US$348.054.7% overvalued
2 followersusers have followed this narrative
0 commentsusers have commented on this narrative
0 likesusers have liked this narrative
KH

Khagani on CoreWeave ·
CoreWeave's Revenue Expected to Rocket 77.88% in 5-Year Forecast
Fair Value:US$11033.5% undervalued
4 followersusers have followed this narrative
0 commentsusers have commented on this narrative
0 likesusers have liked this narrative
PO

PortfolioPlus on Bisalloy Steel Group ·
Bisalloy Steel Group will shine with a projected profit margin increase of 12.8%
Fair Value:AU$6.7118.0% undervalued
3 followersusers have followed this narrative
0 commentsusers have commented on this narrative
0 likesusers have liked this narrative
Popular Narratives
TH

TheWallstreetKing on MicroVision ·
MicroVision will explode future revenue by 380.37% with a vision towards success
Fair Value:US$6098.4% undervalued
108 followersusers have followed this narrative
10 commentsusers have commented on this narrative
21 likesusers have liked this narrative
AN


AnalystConsensusTarget on NVIDIA ·
NVDA: Expanding AI Demand Will Drive Major Data Center Investments Through 2026
Fair Value:US$250.3929.3% undervalued
936 followersusers have followed this narrative
6 commentsusers have commented on this narrative
24 likesusers have liked this narrative
OS


oscargarcia on Alphabet ·
The company that turned a verb into a global necessity and basically runs the modern internet, digital ads, smartphones, maps, and AI.
Fair Value:US$3405.8% undervalued
144 followersusers have followed this narrative
6 commentsusers have commented on this narrative
18 likesusers have liked this narrative