
Advertisement
Huddly AS (OB:HDLY) shareholders are no doubt pleased to see that the share price has bounced 30% in the last month, although it is still struggling to make up recently lost ground. Still, the 30-day jump doesn't change the fact that longer term shareholders have seen their stock decimated by the 73% share price drop in the last twelve months.
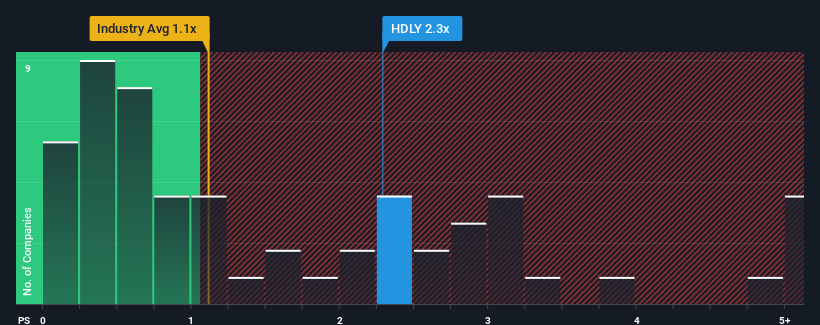
Following the firm bounce in price, given close to half the companies operating in Norway's Communications industry have price-to-sales ratios (or "P/S") below 1.1x, you may consider Huddly as a stock to potentially avoid with its 2.3x P/S ratio. Although, it's not wise to just take the P/S at face value as there may be an explanation why it's as high as it is.
Our free stock report includes 4 warning signs investors should be aware of before investing in Huddly. Read for free now.View our latest analysis for Huddly
How Huddly Has Been Performing
For example, consider that Huddly's financial performance has been poor lately as its revenue has been in decline. One possibility is that the P/S is high because investors think the company will still do enough to outperform the broader industry in the near future. If not, then existing shareholders may be quite nervous about the viability of the share price.
Although there are no analyst estimates available for Huddly, take a look at this free data-rich visualisation to see how the company stacks up on earnings, revenue and cash flow.Do Revenue Forecasts Match The High P/S Ratio?
Huddly's P/S ratio would be typical for a company that's expected to deliver solid growth, and importantly, perform better than the industry.
Retrospectively, the last year delivered a frustrating 29% decrease to the company's top line. As a result, revenue from three years ago have also fallen 56% overall. So unfortunately, we have to acknowledge that the company has not done a great job of growing revenue over that time.
In contrast to the company, the rest of the industry is expected to grow by 5.3% over the next year, which really puts the company's recent medium-term revenue decline into perspective.
With this information, we find it concerning that Huddly is trading at a P/S higher than the industry. Apparently many investors in the company are way more bullish than recent times would indicate and aren't willing to let go of their stock at any price. Only the boldest would assume these prices are sustainable as a continuation of recent revenue trends is likely to weigh heavily on the share price eventually.
The Bottom Line On Huddly's P/S
Huddly shares have taken a big step in a northerly direction, but its P/S is elevated as a result. Typically, we'd caution against reading too much into price-to-sales ratios when settling on investment decisions, though it can reveal plenty about what other market participants think about the company.
Our examination of Huddly revealed its shrinking revenue over the medium-term isn't resulting in a P/S as low as we expected, given the industry is set to grow. With a revenue decline on investors' minds, the likelihood of a souring sentiment is quite high which could send the P/S back in line with what we'd expect. Should recent medium-term revenue trends persist, it would pose a significant risk to existing shareholders' investments and prospective investors will have a hard time accepting the current value of the stock.
It is also worth noting that we have found 4 warning signs for Huddly (3 make us uncomfortable!) that you need to take into consideration.
Of course, profitable companies with a history of great earnings growth are generally safer bets. So you may wish to see this free collection of other companies that have reasonable P/E ratios and have grown earnings strongly.
Valuation is complex, but we're here to simplify it.
Discover if Huddly might be undervalued or overvalued with our detailed analysis, featuring fair value estimates, potential risks, dividends, insider trades, and its financial condition.
Access Free AnalysisHave feedback on this article? Concerned about the content? Get in touch with us directly. Alternatively, email editorial-team (at) simplywallst.com.
This article by Simply Wall St is general in nature. We provide commentary based on historical data and analyst forecasts only using an unbiased methodology and our articles are not intended to be financial advice. It does not constitute a recommendation to buy or sell any stock, and does not take account of your objectives, or your financial situation. We aim to bring you long-term focused analysis driven by fundamental data. Note that our analysis may not factor in the latest price-sensitive company announcements or qualitative material. Simply Wall St has no position in any stocks mentioned.
About OB:HDLY
Huddly
A technology company, creates tools for team collaboration in Europe, the Middle East, Africa, the Asia Pacific, and the Americas.
Excellent balance sheet with slight risk.
Similar Companies
Market Insights

Advertisement
Community Narratives
MicroVision will explode future revenue by 380.37% with a vision towards success
Fair Value US$60.00|98.5% undervalued
TH
Community Contributor
The Indispensable Artery for a New North American Economy
Fair Value CA$132.87|2.3% undervalued
TI
Community Contributor