
Advertisement
- Norway
- /
- Specialty Stores
- /
- OB:ELIMP
Elektroimportøren AS' (OB:ELIMP) 35% Dip Still Leaving Some Shareholders Feeling Restless Over Its P/SRatio
Elektroimportøren AS (OB:ELIMP) shareholders won't be pleased to see that the share price has had a very rough month, dropping 35% and undoing the prior period's positive performance. The recent drop completes a disastrous twelve months for shareholders, who are sitting on a 78% loss during that time.
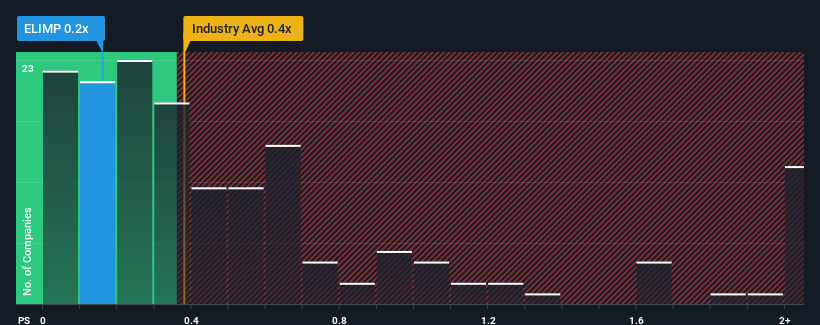
In spite of the heavy fall in price, it's still not a stretch to say that Elektroimportøren's price-to-sales (or "P/S") ratio of 0.2x right now seems quite "middle-of-the-road" compared to the Specialty Retail industry in Norway, where the median P/S ratio is around 0.3x. While this might not raise any eyebrows, if the P/S ratio is not justified investors could be missing out on a potential opportunity or ignoring looming disappointment.
Check out our latest analysis for Elektroimportøren
What Does Elektroimportøren's P/S Mean For Shareholders?
Recent times haven't been great for Elektroimportøren as its revenue has been rising slower than most other companies. It might be that many expect the uninspiring revenue performance to strengthen positively, which has kept the P/S ratio from falling. If not, then existing shareholders may be a little nervous about the viability of the share price.
If you'd like to see what analysts are forecasting going forward, you should check out our free report on Elektroimportøren.Do Revenue Forecasts Match The P/S Ratio?
Elektroimportøren's P/S ratio would be typical for a company that's only expected to deliver moderate growth, and importantly, perform in line with the industry.
If we review the last year of revenue, the company posted a result that saw barely any deviation from a year ago. Still, the latest three year period was better as it's delivered a decent 22% overall rise in revenue. So it appears to us that the company has had a mixed result in terms of growing revenue over that time.
Turning to the outlook, the next year should generate growth of 4.9% as estimated by the one analyst watching the company. That's shaping up to be materially lower than the 7.3% growth forecast for the broader industry.
With this in mind, we find it intriguing that Elektroimportøren's P/S is closely matching its industry peers. It seems most investors are ignoring the fairly limited growth expectations and are willing to pay up for exposure to the stock. These shareholders may be setting themselves up for future disappointment if the P/S falls to levels more in line with the growth outlook.
The Bottom Line On Elektroimportøren's P/S
With its share price dropping off a cliff, the P/S for Elektroimportøren looks to be in line with the rest of the Specialty Retail industry. While the price-to-sales ratio shouldn't be the defining factor in whether you buy a stock or not, it's quite a capable barometer of revenue expectations.
When you consider that Elektroimportøren's revenue growth estimates are fairly muted compared to the broader industry, it's easy to see why we consider it unexpected to be trading at its current P/S ratio. When we see companies with a relatively weaker revenue outlook compared to the industry, we suspect the share price is at risk of declining, sending the moderate P/S lower. Circumstances like this present a risk to current and prospective investors who may see share prices fall if the low revenue growth impacts the sentiment.
And what about other risks? Every company has them, and we've spotted 5 warning signs for Elektroimportøren (of which 1 can't be ignored!) you should know about.
If strong companies turning a profit tickle your fancy, then you'll want to check out this free list of interesting companies that trade on a low P/E (but have proven they can grow earnings).
Valuation is complex, but we're here to simplify it.
Discover if Elektroimportøren might be undervalued or overvalued with our detailed analysis, featuring fair value estimates, potential risks, dividends, insider trades, and its financial condition.
Access Free AnalysisHave feedback on this article? Concerned about the content? Get in touch with us directly. Alternatively, email editorial-team (at) simplywallst.com.
This article by Simply Wall St is general in nature. We provide commentary based on historical data and analyst forecasts only using an unbiased methodology and our articles are not intended to be financial advice. It does not constitute a recommendation to buy or sell any stock, and does not take account of your objectives, or your financial situation. We aim to bring you long-term focused analysis driven by fundamental data. Note that our analysis may not factor in the latest price-sensitive company announcements or qualitative material. Simply Wall St has no position in any stocks mentioned.
About OB:ELIMP
Elektroimportøren
Engages in the sale of electrical installation products to private and professional customers in Norway.
Undervalued with excellent balance sheet.
Market Insights

Advertisement
Community Narratives
The company that turned a verb into a global necessity and basically runs the modern internet, digital ads, smartphones, maps, and AI.
Fair Value US$300.00|6.2% undervalued
OS
Community Contributor
Flowers Foods Pays A Fair Price For Health
Fair Value US$16.12|25.1% undervalued
NV
Community Contributor
TMX Group will thrive with 33.3% profit margin and enduring market moat
Fair Value CA$49.90|0.04% overvalued
LI
Community Contributor