
Advertisement
Arcus ASA's (OB:ARCUS) Fundamentals Look Pretty Strong: Could The Market Be Wrong About The Stock?
With its stock down 5.3% over the past three months, it is easy to disregard Arcus (OB:ARCUS). But if you pay close attention, you might gather that its strong financials could mean that the stock could potentially see an increase in value in the long-term, given how markets usually reward companies with good financial health. Specifically, we decided to study Arcus' ROE in this article.
ROE or return on equity is a useful tool to assess how effectively a company can generate returns on the investment it received from its shareholders. In short, ROE shows the profit each dollar generates with respect to its shareholder investments.
See our latest analysis for Arcus
How Do You Calculate Return On Equity?
The formula for ROE is:
Return on Equity = Net Profit (from continuing operations) ÷ Shareholders' Equity
So, based on the above formula, the ROE for Arcus is:
10% = kr171m ÷ kr1.6b (Based on the trailing twelve months to March 2021).
The 'return' is the income the business earned over the last year. Another way to think of that is that for every NOK1 worth of equity, the company was able to earn NOK0.10 in profit.
Why Is ROE Important For Earnings Growth?
We have already established that ROE serves as an efficient profit-generating gauge for a company's future earnings. Based on how much of its profits the company chooses to reinvest or "retain", we are then able to evaluate a company's future ability to generate profits. Assuming all else is equal, companies that have both a higher return on equity and higher profit retention are usually the ones that have a higher growth rate when compared to companies that don't have the same features.
Arcus' Earnings Growth And 10% ROE
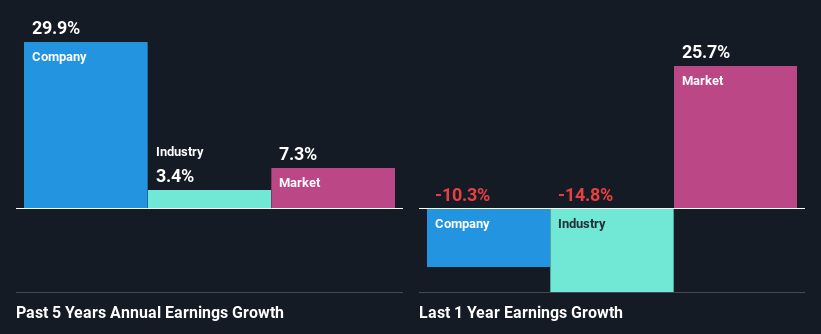
At first glance, Arcus seems to have a decent ROE. Especially when compared to the industry average of 8.2% the company's ROE looks pretty impressive. Probably as a result of this, Arcus was able to see an impressive net income growth of 30% over the last five years. We believe that there might also be other aspects that are positively influencing the company's earnings growth. For example, it is possible that the company's management has made some good strategic decisions, or that the company has a low payout ratio.
As a next step, we compared Arcus' net income growth with the industry, and pleasingly, we found that the growth seen by the company is higher than the average industry growth of 5.5%.
Earnings growth is an important metric to consider when valuing a stock. The investor should try to establish if the expected growth or decline in earnings, whichever the case may be, is priced in. This then helps them determine if the stock is placed for a bright or bleak future. If you're wondering about Arcus''s valuation, check out this gauge of its price-to-earnings ratio, as compared to its industry.
Is Arcus Using Its Retained Earnings Effectively?
Arcus' significant three-year median payout ratio of 67% (where it is retaining only 33% of its income) suggests that the company has been able to achieve a high growth in earnings despite returning most of its income to shareholders.
Additionally, Arcus has paid dividends over a period of four years which means that the company is pretty serious about sharing its profits with shareholders.
Conclusion
On the whole, we feel that Arcus' performance has been quite good. We are particularly impressed by the considerable earnings growth posted by the company, which was likely backed by its high ROE. While the company is paying out most of its earnings as dividends, it has been able to grow its earnings in spite of it, so that's probably a good sign. Until now, we have only just grazed the surface of the company's past performance by looking at the company's fundamentals. You can do your own research on Arcus and see how it has performed in the past by looking at this FREE detailed graph of past earnings, revenue and cash flows.
If you’re looking to trade Arcus, open an account with the lowest-cost* platform trusted by professionals, Interactive Brokers. Their clients from over 200 countries and territories trade stocks, options, futures, forex, bonds and funds worldwide from a single integrated account. Promoted
New: Manage All Your Stock Portfolios in One Place
We've created the ultimate portfolio companion for stock investors, and it's free.
• Connect an unlimited number of Portfolios and see your total in one currency
• Be alerted to new Warning Signs or Risks via email or mobile
• Track the Fair Value of your stocks
This article by Simply Wall St is general in nature. It does not constitute a recommendation to buy or sell any stock, and does not take account of your objectives, or your financial situation. We aim to bring you long-term focused analysis driven by fundamental data. Note that our analysis may not factor in the latest price-sensitive company announcements or qualitative material. Simply Wall St has no position in any stocks mentioned.
*Interactive Brokers Rated Lowest Cost Broker by StockBrokers.com Annual Online Review 2020
Have feedback on this article? Concerned about the content? Get in touch with us directly. Alternatively, email editorial-team (at) simplywallst.com.
Market Insights

Advertisement
Community Narratives
The company that turned a verb into a global necessity and basically runs the modern internet, digital ads, smartphones, maps, and AI.
Fair Value US$300.00|10.2% undervalued
OS
Community Contributor
Flowers Foods Pays A Fair Price For Health
Fair Value US$16.12|20.3% undervalued
NV
Community Contributor
TMX Group will thrive with 33.3% profit margin and enduring market moat
Fair Value CA$49.90|0.1% undervalued
LI
Community Contributor