
Advertisement
Warren Buffett famously said, 'Volatility is far from synonymous with risk.' So it might be obvious that you need to consider debt, when you think about how risky any given stock is, because too much debt can sink a company. We can see that TGS ASA (OB:TGS) does use debt in its business. But is this debt a concern to shareholders?
What Risk Does Debt Bring?
Generally speaking, debt only becomes a real problem when a company can't easily pay it off, either by raising capital or with its own cash flow. In the worst case scenario, a company can go bankrupt if it cannot pay its creditors. However, a more common (but still painful) scenario is that it has to raise new equity capital at a low price, thus permanently diluting shareholders. Having said that, the most common situation is where a company manages its debt reasonably well - and to its own advantage. The first step when considering a company's debt levels is to consider its cash and debt together.
What Is TGS's Net Debt?
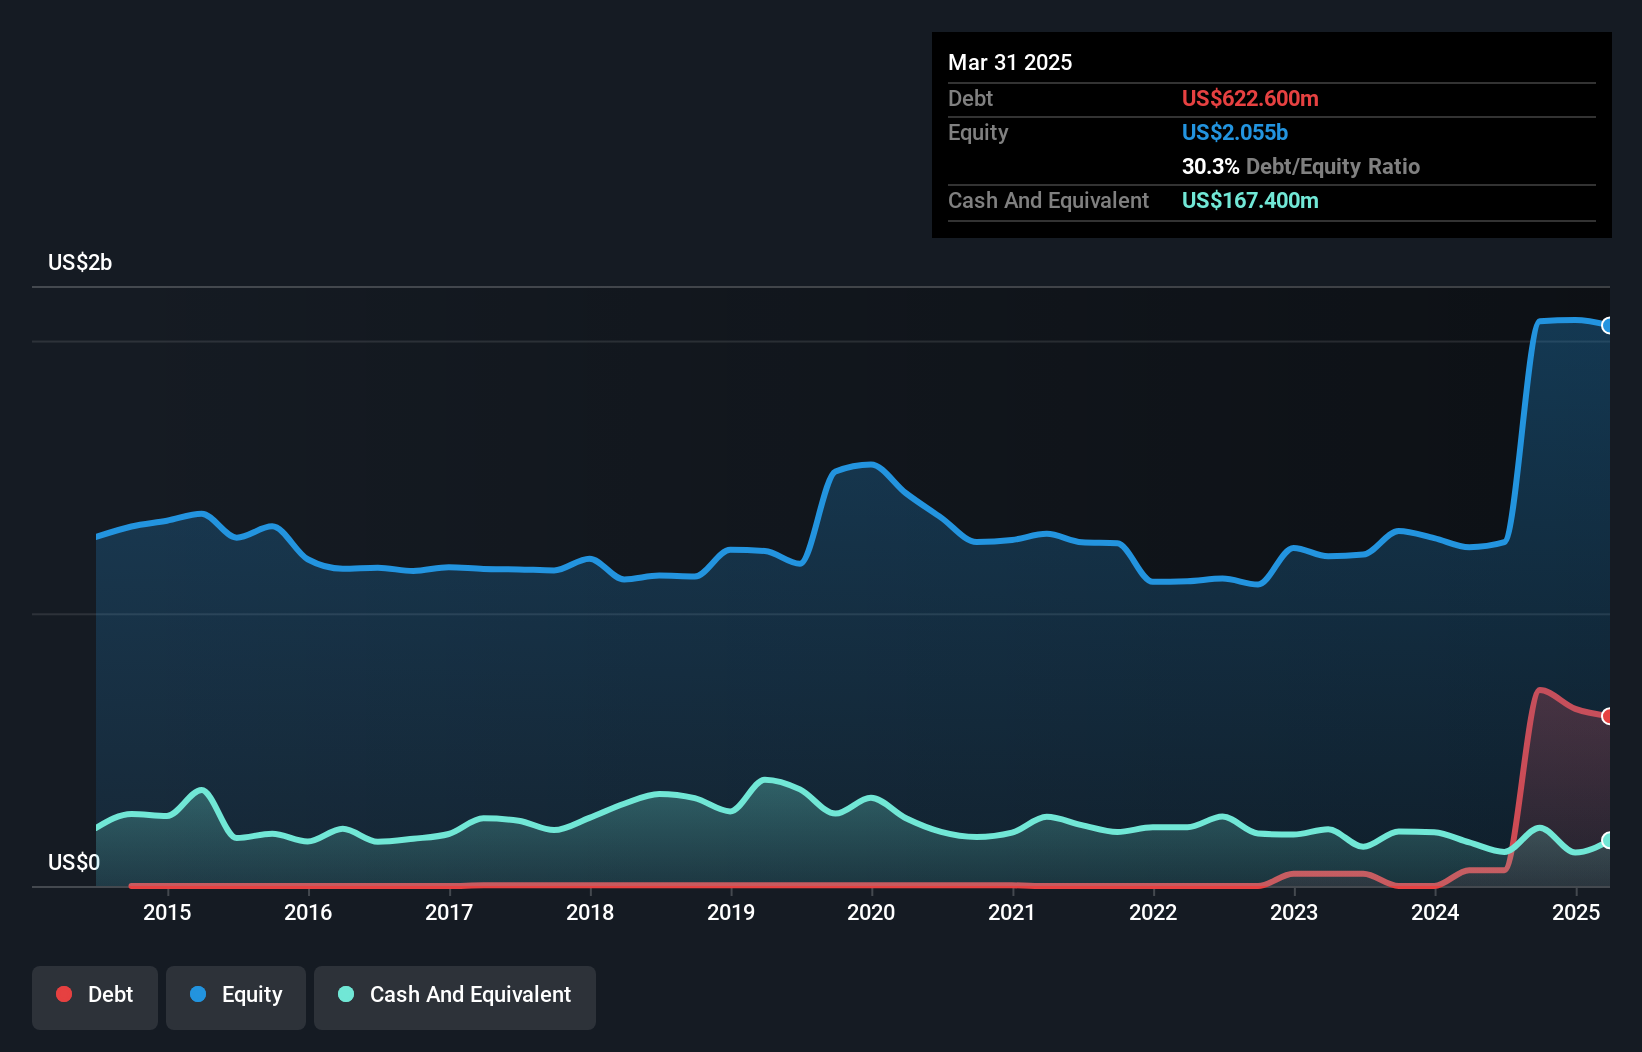
As you can see below, at the end of March 2025, TGS had US$622.6m of debt, up from US$58.2m a year ago. Click the image for more detail. However, it also had US$167.4m in cash, and so its net debt is US$455.2m.
How Healthy Is TGS' Balance Sheet?
According to the last reported balance sheet, TGS had liabilities of US$1.07b due within 12 months, and liabilities of US$759.8m due beyond 12 months. On the other hand, it had cash of US$167.4m and US$376.4m worth of receivables due within a year. So its liabilities outweigh the sum of its cash and (near-term) receivables by US$1.28b.
This is a mountain of leverage relative to its market capitalization of US$1.68b. Should its lenders demand that it shore up the balance sheet, shareholders would likely face severe dilution.
See our latest analysis for TGS
In order to size up a company's debt relative to its earnings, we calculate its net debt divided by its earnings before interest, tax, depreciation, and amortization (EBITDA) and its earnings before interest and tax (EBIT) divided by its interest expense (its interest cover). This way, we consider both the absolute quantum of the debt, as well as the interest rates paid on it.
TGS has net debt of just 0.56 times EBITDA, indicating that it is certainly not a reckless borrower. And it boasts interest cover of 9.9 times, which is more than adequate. Better yet, TGS grew its EBIT by 329% last year, which is an impressive improvement. That boost will make it even easier to pay down debt going forward. When analysing debt levels, the balance sheet is the obvious place to start. But it is future earnings, more than anything, that will determine TGS's ability to maintain a healthy balance sheet going forward. So if you want to see what the professionals think, you might find this free report on analyst profit forecasts to be interesting.
But our final consideration is also important, because a company cannot pay debt with paper profits; it needs cold hard cash. So we always check how much of that EBIT is translated into free cash flow. During the last three years, TGS produced sturdy free cash flow equating to 60% of its EBIT, about what we'd expect. This cold hard cash means it can reduce its debt when it wants to.

Our View
The good news is that TGS's demonstrated ability to grow its EBIT delights us like a fluffy puppy does a toddler. But, on a more sombre note, we are a little concerned by its level of total liabilities. All these things considered, it appears that TGS can comfortably handle its current debt levels. On the plus side, this leverage can boost shareholder returns, but the potential downside is more risk of loss, so it's worth monitoring the balance sheet. When analysing debt levels, the balance sheet is the obvious place to start. However, not all investment risk resides within the balance sheet - far from it. For example TGS has 3 warning signs (and 1 which shouldn't be ignored) we think you should know about.
At the end of the day, it's often better to focus on companies that are free from net debt. You can access our special list of such companies (all with a track record of profit growth). It's free.
Valuation is complex, but we're here to simplify it.
Discover if TGS might be undervalued or overvalued with our detailed analysis, featuring fair value estimates, potential risks, dividends, insider trades, and its financial condition.
Access Free AnalysisHave feedback on this article? Concerned about the content? Get in touch with us directly. Alternatively, email editorial-team (at) simplywallst.com.
This article by Simply Wall St is general in nature. We provide commentary based on historical data and analyst forecasts only using an unbiased methodology and our articles are not intended to be financial advice. It does not constitute a recommendation to buy or sell any stock, and does not take account of your objectives, or your financial situation. We aim to bring you long-term focused analysis driven by fundamental data. Note that our analysis may not factor in the latest price-sensitive company announcements or qualitative material. Simply Wall St has no position in any stocks mentioned.
About OB:TGS
TGS
Provides geoscience data services to the oil and gas industry in Norway and internationally.
Moderate growth potential with mediocre balance sheet.
Similar Companies
Market Insights

Advertisement
Community Narratives
MINISO's fair value is projected at 26.69 with an anticipated PE ratio shift of 20x
Fair Value US$24.03|11.4% undervalued
BE
Community Contributor
Procter & Gamble: A Dividend Giant Facing Slowing Growth
Fair Value US$119.81|23.5% overvalued
AN
Community Contributor
Eli Lilly's Future Growth Driven by Tirzepatide and Favorable Market Conditions
Fair Value US$1.19k|14.0% undervalued
EA
Community Contributor