Advertisement
- Sweden
- /
- Capital Markets
- /
- OM:VO2
Discover 3 European Penny Stocks With Market Caps Over €40M

Simply Wall St
Reviewed by Simply Wall St
Amidst renewed worries about inflated AI stock valuations and receding expectations for a U.S. interest rate cut, European markets have seen a downturn, with major indices such as the STOXX Europe 600 Index experiencing declines. Despite these challenges, investors continue to explore opportunities in the market's less prominent corners. Penny stocks, often representing smaller or newer companies, remain an intriguing area for those seeking growth potential at lower price points. In this article, we explore three European penny stocks that demonstrate strong balance sheets and solid fundamentals, offering hidden value and potential upside in today's market landscape.
Top 10 Penny Stocks In Europe
| Name | Share Price | Market Cap | Rewards & Risks |
| Ariston Holding (BIT:ARIS) | €4.062 | €1.41B | ✅ 5 ⚠️ 2 View Analysis > |
| Orthex Oyj (HLSE:ORTHEX) | €4.70 | €83.47M | ✅ 4 ⚠️ 1 View Analysis > |
| Lucisano Media Group (BIT:LMG) | €1.03 | €15.3M | ✅ 4 ⚠️ 5 View Analysis > |
| Angler Gaming (NGM:ANGL) | SEK3.60 | SEK269.95M | ✅ 4 ⚠️ 2 View Analysis > |
| Angler Gaming (DB:0QM) | €0.37 | €232.45M | ✅ 3 ⚠️ 3 View Analysis > |
| Libertas 7 (BME:LIB) | €3.10 | €65.75M | ✅ 3 ⚠️ 3 View Analysis > |
| ForFarmers (ENXTAM:FFARM) | €4.34 | €383.59M | ✅ 4 ⚠️ 1 View Analysis > |
| High (ENXTPA:HCO) | €3.85 | €75.08M | ✅ 1 ⚠️ 5 View Analysis > |
| Deceuninck (ENXTBR:DECB) | €2.17 | €299.94M | ✅ 3 ⚠️ 1 View Analysis > |
| Netgem (ENXTPA:ALNTG) | €0.848 | €28.4M | ✅ 2 ⚠️ 2 View Analysis > |
Click here to see the full list of 276 stocks from our European Penny Stocks screener.
Below we spotlight a couple of our favorites from our exclusive screener.
Maps (BIT:MAPS)
Simply Wall St Financial Health Rating: ★★★★★★
Overview: Maps S.p.A. is a software solution provider that designs and develops technological solutions to aid decision-making processes for public and private entities, with a market cap of €43.70 million.
Operations: Revenue Segments: No specific revenue segments have been reported for Maps S.p.A.
Market Cap: €43.7M
Maps S.p.A., with a market cap of €43.70 million, has shown solid financial stability, with short-term assets exceeding both its short and long-term liabilities. The company has managed to reduce its debt-to-equity ratio significantly over five years and maintains well-covered interest payments by EBIT. Despite a low return on equity of 7.1%, Maps's earnings grew by 64.3% last year, surpassing industry growth rates, while revenue increased to €17.32 million for the half-year ending June 2025 from €16.12 million the previous year, indicating positive momentum in its financial performance amidst stable weekly volatility at 3%.
- Get an in-depth perspective on Maps' performance by reading our balance sheet health report here.
- Gain insights into Maps' outlook and expected performance with our report on the company's earnings estimates.

Petrolia (OB:PSE)
Simply Wall St Financial Health Rating: ★★★★★★
Overview: Petrolia SE, with a market cap of NOK265.65 million, operates in the rental and sale of energy service equipment to the energy industry across Norway, Europe, Asia, and Australia.
Operations: The company generates revenue from its Energy Service segment, amounting to $55.55 million.
Market Cap: NOK265.65M
Petrolia SE, with a market cap of NOK265.65 million, has demonstrated financial resilience in the energy service sector. Despite experiencing a decline in net profit margins from 9% to 6.5%, the company reported first-half 2025 sales of US$27.85 million, up from US$25.77 million the previous year, and net income of US$3.33 million. Petrolia's debt is well covered by operating cash flow and its short-term assets exceed both short and long-term liabilities, indicating strong liquidity management. However, recent negative earnings growth contrasts with its five-year profitability trend amidst high share price volatility over three months.
- Jump into the full analysis health report here for a deeper understanding of Petrolia.
- Explore historical data to track Petrolia's performance over time in our past results report.
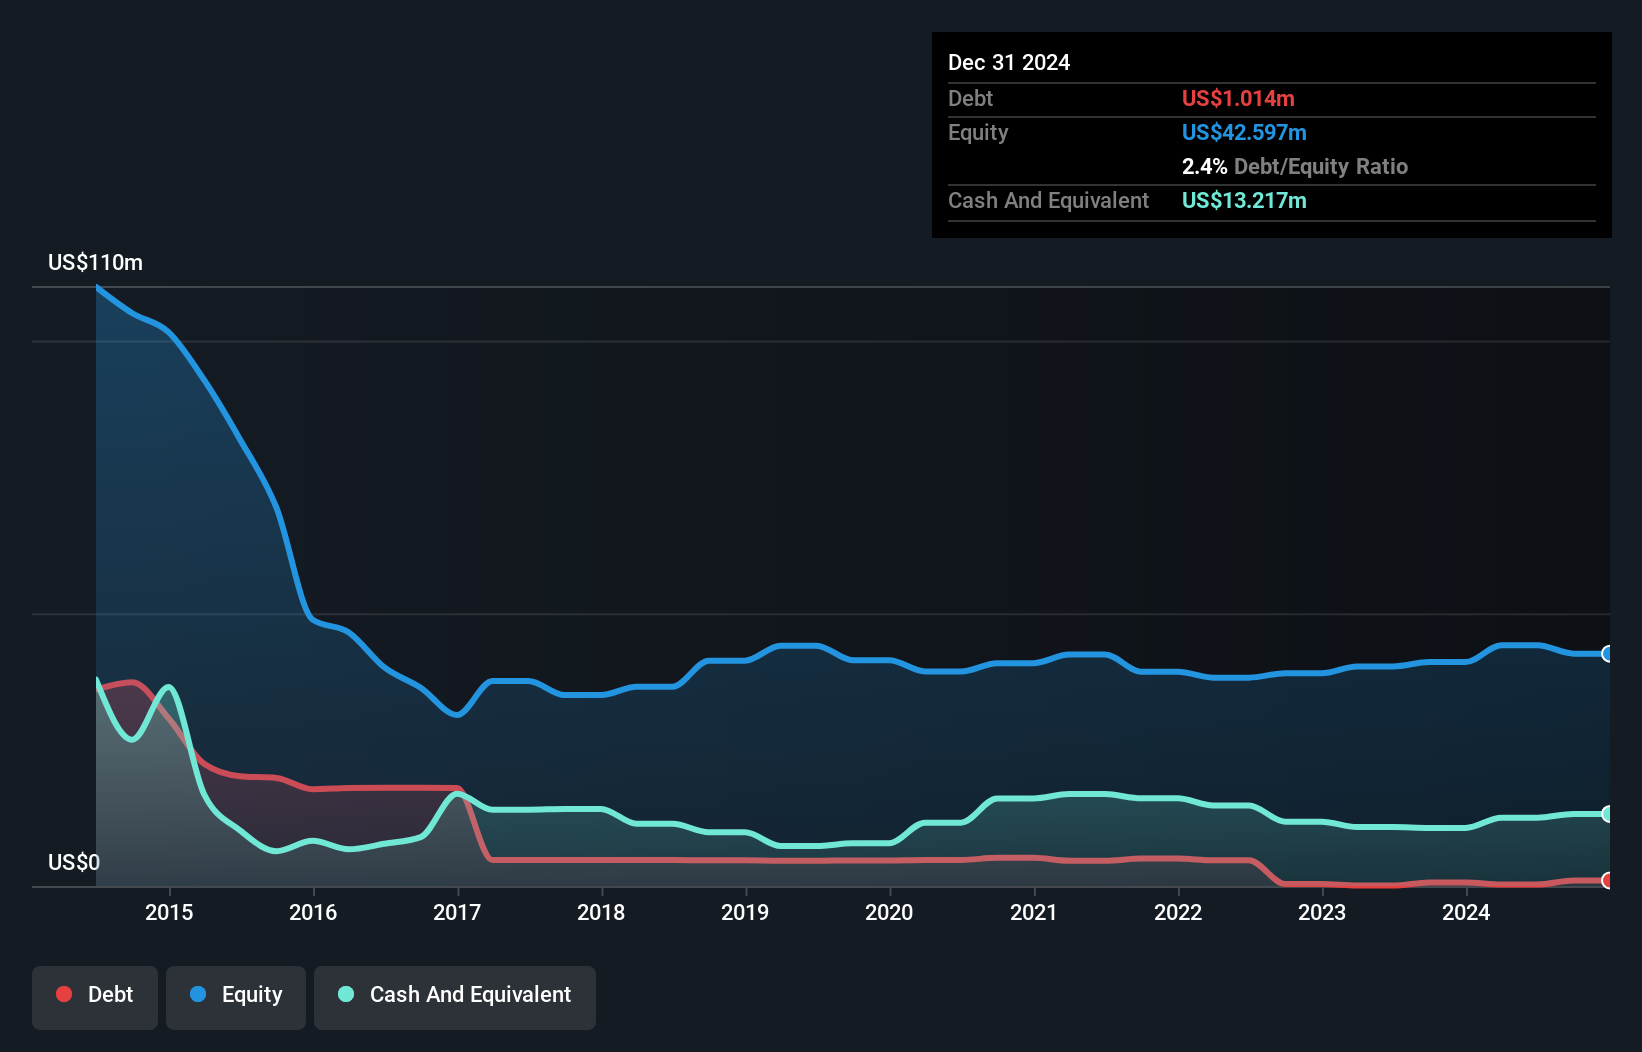
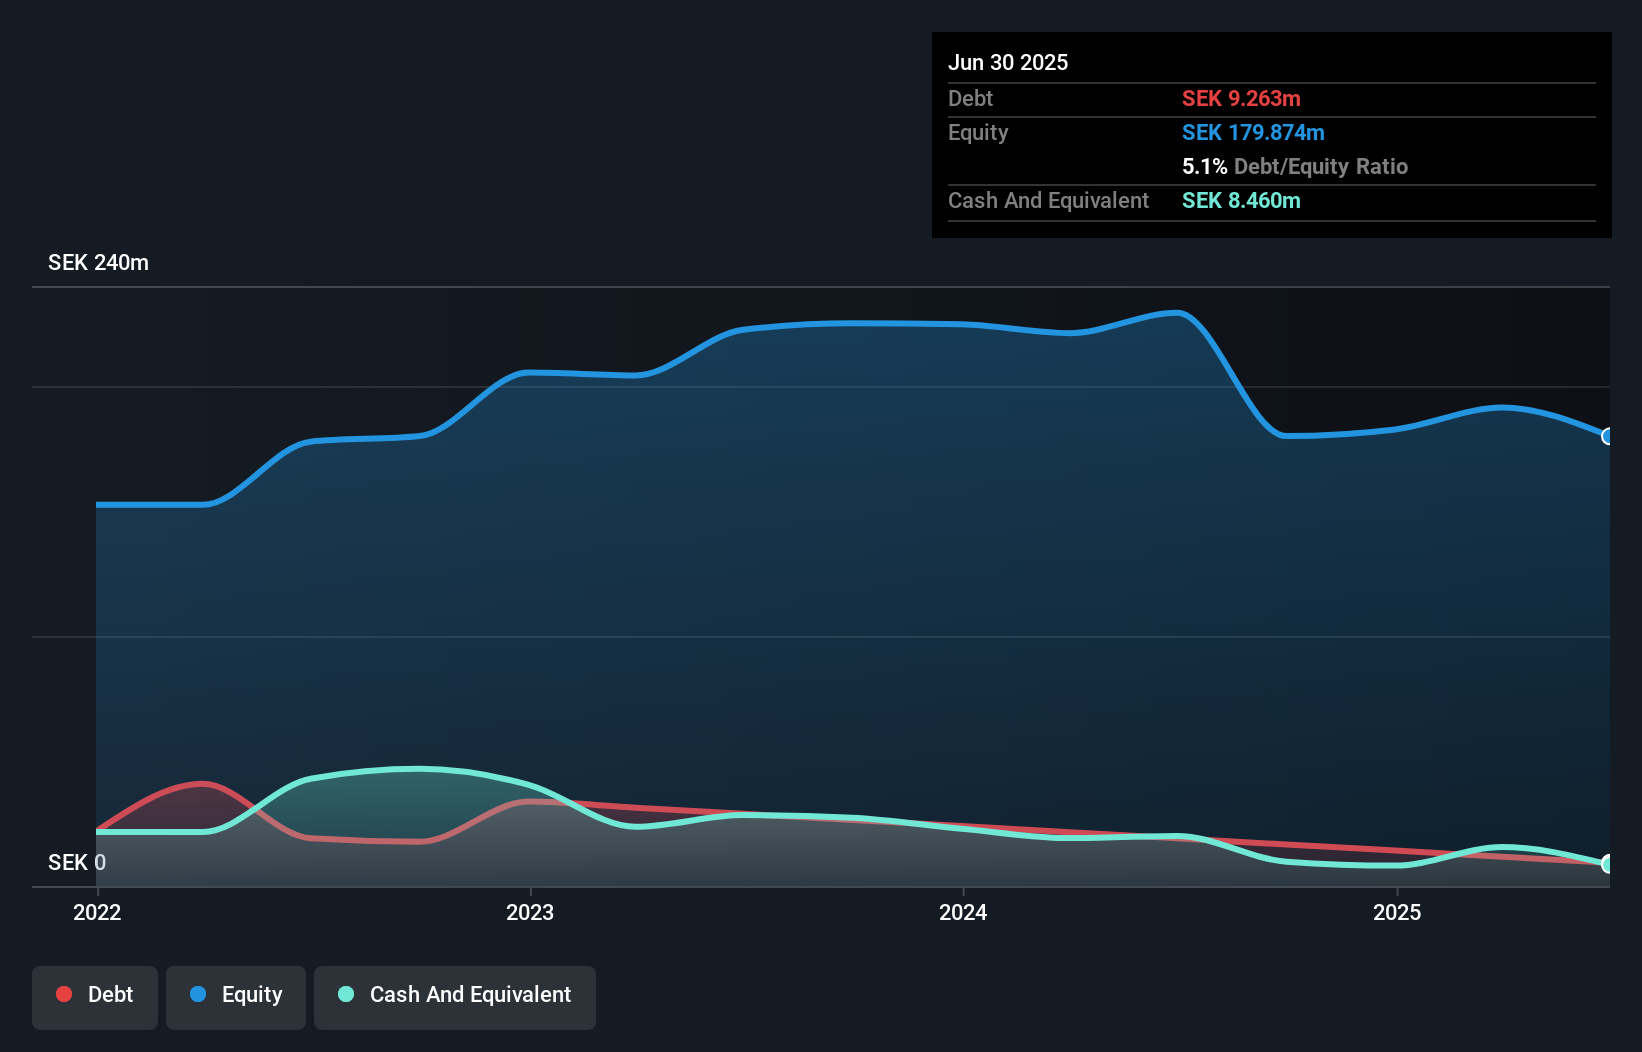
Vo2 Cap Holding (OM:VO2)
Simply Wall St Financial Health Rating: ★★★★☆☆
Overview: Vo2 Cap Holding AB (publ) operates in the media tech industry with a market capitalization of SEK133.66 million.
Operations: The company generates revenue of SEK358.998 million from its advertising segment.
Market Cap: SEK133.66M
Vo2 Cap Holding AB, with a market cap of SEK133.66 million, operates in the media tech industry and has shown some positive financial developments despite being unprofitable. The company reported third-quarter sales of SEK72.46 million, up from SEK69.72 million the previous year, and achieved a net income of SEK2.94 million compared to a significant loss previously. While its short-term assets do not cover its short-term liabilities, Vo2 maintains more cash than total debt and has sufficient cash runway for over three years if current free cash flow levels are sustained. Earnings are expected to grow significantly annually at 109.59%.
- Dive into the specifics of Vo2 Cap Holding here with our thorough balance sheet health report.
- Examine Vo2 Cap Holding's earnings growth report to understand how analysts expect it to perform.
Seize The Opportunity
- Discover the full array of 276 European Penny Stocks right here.
- Looking For Alternative Opportunities? The latest GPUs need a type of rare earth metal called Neodymium and there are only 35 companies in the world exploring or producing it. Find the list for free.
This article by Simply Wall St is general in nature. We provide commentary based on historical data and analyst forecasts only using an unbiased methodology and our articles are not intended to be financial advice. It does not constitute a recommendation to buy or sell any stock, and does not take account of your objectives, or your financial situation. We aim to bring you long-term focused analysis driven by fundamental data. Note that our analysis may not factor in the latest price-sensitive company announcements or qualitative material. Simply Wall St has no position in any stocks mentioned.
New: Manage All Your Stock Portfolios in One Place
We've created the ultimate portfolio companion for stock investors, and it's free.
• Connect an unlimited number of Portfolios and see your total in one currency
• Be alerted to new Warning Signs or Risks via email or mobile
• Track the Fair Value of your stocks
Have feedback on this article? Concerned about the content? Get in touch with us directly. Alternatively, email editorial-team@simplywallst.com
About OM:VO2
Adequate balance sheet and fair value.
Market Insights

Advertisement
Community Narratives
MicroVision will explode future revenue by 380.37% with a vision towards success
Fair Value US$60|98.4% undervalued
TH
Community Contributor
The Indispensable Artery for a New North American Economy
Fair Value CA$132.87|0.6% undervalued
TI
Community Contributor
Recently Updated Narratives
BL


BlackGoat on Alphabet ·
Alphabet: The Under-appreciated Compounder Hiding in Plain Sight
Fair Value:US$324.481.3% undervalued
76 followersusers have followed this narrative
3 commentsusers have commented on this narrative
1 likeusers have liked this narrative
BE


Bejgal on MINISO Group Holding ·
MINISO's fair value is projected at 26.69 with an anticipated PE ratio shift of 20x
Fair Value:US$26.6926.7% undervalued
45 followersusers have followed this narrative
3 commentsusers have commented on this narrative
0 likesusers have liked this narrative
TI


TickerTickle on Oracle ·
The Quiet Giant That Became AI’s Power Grid
Fair Value:US$389.8147.4% undervalued
9 followersusers have followed this narrative
1 commentusers have commented on this narrative
0 likesusers have liked this narrative
Popular Narratives
OS

oscargarcia on Alphabet ·
The company that turned a verb into a global necessity and basically runs the modern internet, digital ads, smartphones, maps, and AI.
Fair Value:US$3405.9% undervalued
136 followersusers have followed this narrative
6 commentsusers have commented on this narrative
18 likesusers have liked this narrative
TH

TheWallstreetKing on MicroVision ·
MicroVision will explode future revenue by 380.37% with a vision towards success
Fair Value:US$6098.4% undervalued
89 followersusers have followed this narrative
10 commentsusers have commented on this narrative
18 likesusers have liked this narrative
AN


AnalystConsensusTarget on NVIDIA ·
NVDA: Expanding AI Demand Will Drive Major Data Center Investments Through 2026
Fair Value:US$232.7922.6% undervalued
927 followersusers have followed this narrative
6 commentsusers have commented on this narrative
22 likesusers have liked this narrative