
Advertisement
- Norway
- /
- Oil and Gas
- /
- OB:IOX
Interoil Exploration and Production ASA (OB:IOX) Might Not Be As Mispriced As It Looks
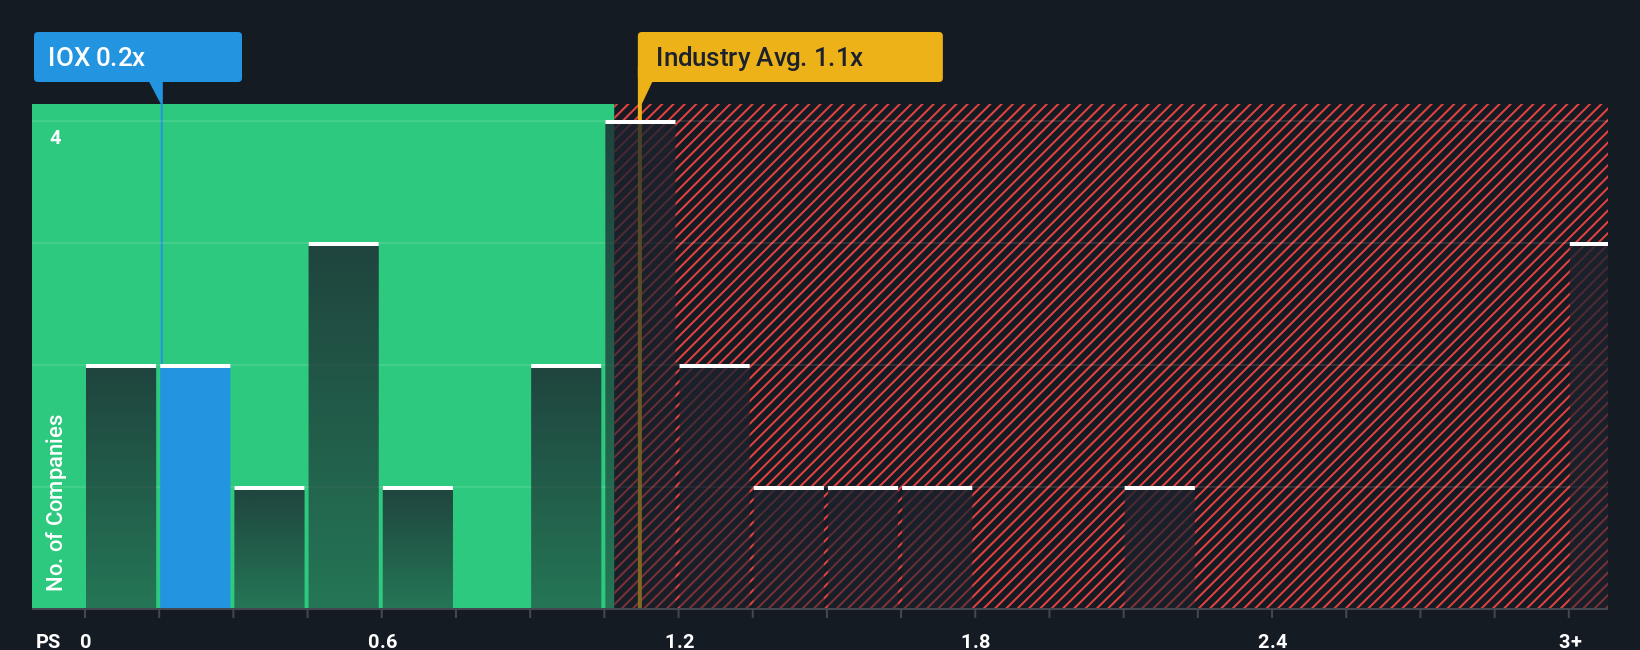
When close to half the companies operating in the Oil and Gas industry in Norway have price-to-sales ratios (or "P/S") above 1.1x, you may consider Interoil Exploration and Production ASA (OB:IOX) as an attractive investment with its 0.2x P/S ratio. Nonetheless, we'd need to dig a little deeper to determine if there is a rational basis for the reduced P/S.
See our latest analysis for Interoil Exploration and Production
What Does Interoil Exploration and Production's Recent Performance Look Like?
As an illustration, revenue has deteriorated at Interoil Exploration and Production over the last year, which is not ideal at all. One possibility is that the P/S is low because investors think the company won't do enough to avoid underperforming the broader industry in the near future. Those who are bullish on Interoil Exploration and Production will be hoping that this isn't the case so that they can pick up the stock at a lower valuation.
Want the full picture on earnings, revenue and cash flow for the company? Then our free report on Interoil Exploration and Production will help you shine a light on its historical performance.What Are Revenue Growth Metrics Telling Us About The Low P/S?
The only time you'd be truly comfortable seeing a P/S as low as Interoil Exploration and Production's is when the company's growth is on track to lag the industry.
Taking a look back first, the company's revenue growth last year wasn't something to get excited about as it posted a disappointing decline of 35%. The last three years don't look nice either as the company has shrunk revenue by 8.4% in aggregate. Therefore, it's fair to say the revenue growth recently has been undesirable for the company.
Comparing that to the industry, which is predicted to shrink 6.5% in the next 12 months, the company's downward momentum is still superior based on recent medium-term annualised revenue results.
With this information, it's perhaps strange but not a major surprise that Interoil Exploration and Production is trading at a lower P/S in comparison. There's no guarantee the P/S has found a floor yet with recent revenue going backwards, despite the industry heading down even harder. There is still potential for the P/S to fall to even lower levels if the company doesn't improve its top-line growth, which would be difficult to do with the current industry outlook.
What We Can Learn From Interoil Exploration and Production's P/S?
It's argued the price-to-sales ratio is an inferior measure of value within certain industries, but it can be a powerful business sentiment indicator.
A look into numbers has shown it's somewhat unexpected that Interoil Exploration and Production has a lower P/S than the industry average, given its recent three-year revenue performance which was better than anticipated for an industry facing challenges. There could be some major unobserved threats to revenue preventing the P/S ratio from matching this comparatively more attractive revenue performance. We'd hazard a guess that some investors are concerned about the company's revenue performance tailing off amidst these tough industry conditions. At least the risk of a price drop looks to be subdued, but investors seem to think future revenue could see a lot of volatility.
Don't forget that there may be other risks. For instance, we've identified 5 warning signs for Interoil Exploration and Production (4 are concerning) you should be aware of.
If strong companies turning a profit tickle your fancy, then you'll want to check out this free list of interesting companies that trade on a low P/E (but have proven they can grow earnings).
New: AI Stock Screener & Alerts
Our new AI Stock Screener scans the market every day to uncover opportunities.
• Dividend Powerhouses (3%+ Yield)
• Undervalued Small Caps with Insider Buying
• High growth Tech and AI Companies
Or build your own from over 50 metrics.
Have feedback on this article? Concerned about the content? Get in touch with us directly. Alternatively, email editorial-team (at) simplywallst.com.
This article by Simply Wall St is general in nature. We provide commentary based on historical data and analyst forecasts only using an unbiased methodology and our articles are not intended to be financial advice. It does not constitute a recommendation to buy or sell any stock, and does not take account of your objectives, or your financial situation. We aim to bring you long-term focused analysis driven by fundamental data. Note that our analysis may not factor in the latest price-sensitive company announcements or qualitative material. Simply Wall St has no position in any stocks mentioned.
About OB:IOX
Interoil Exploration and Production
Operates as an upstream oil exploration and production company in Argentina and Colombia.
Moderate risk and slightly overvalued.
Market Insights

Advertisement
Community Narratives
The company that turned a verb into a global necessity and basically runs the modern internet, digital ads, smartphones, maps, and AI.
Fair Value US$300.00|5.2% undervalued
OS
Community Contributor
Flowers Foods Pays A Fair Price For Health
Fair Value US$16.12|24.9% undervalued
NV
Community Contributor
TMX Group will thrive with 33.3% profit margin and enduring market moat
Fair Value CA$49.90|3.3% overvalued
LI
Community Contributor
The "Molecular Pencil": Why Beam's Technology is Built to Win
Fair Value US$65.01|64.5% undervalued
DA
Community Contributor