Advertisement
- Norway
- /
- Oil and Gas
- /
- OB:EQNR
Is Equinor’s Share Price Drop an Opportunity After Offshore Wind Expansion News?

Simply Wall St
Reviewed by Bailey Pemberton
- Wondering if Equinor stock is really good value, or if it's just caught up in market noise? You're not alone. Today's analysis could help clarify things.
- Recently, Equinor's share price has moved a modest 0.5% higher over the last week, but is still down 1.8% over the past month and 12.7% year-to-date. This comes despite delivering a solid 160.2% return over the past five years.
- This mix of short-term ups and downs comes against a backdrop of shifting energy prices and market attention on renewables. Equinor has made headlines for expanding its offshore wind projects. Investors and analysts have been watching closely as these updates play a large role in shaping sentiment and future expectations for the company.
- On the valuation front, Equinor currently scores 4 out of 6 on our valuation checks. This indicates some strengths but also areas worth a closer look. Here we break down what this score really means, explore multiple valuation approaches, and preview a more insightful way to cut through the noise coming up at the end of our review.
Find out why Equinor's 2.1% return over the last year is lagging behind its peers.
Approach 1: Equinor Discounted Cash Flow (DCF) Analysis
The Discounted Cash Flow (DCF) model estimates what Equinor should be worth by projecting its future cash flows and discounting those back to today. This approach aims to reflect all the cash the company is expected to generate for shareholders, giving investors a holistic sense of value based on fundamentals rather than market speculation.
Currently, Equinor's Free Cash Flow stands at $8.96 billion over the last twelve months. Analysts provide direct forecasts for several years, and these show cash flows expected to fluctuate but remain robust. For example, projections see Free Cash Flow reaching $5.78 billion by the end of 2029. After analyst coverage ends, Simply Wall St extrapolates additional years using conservative growth rates to round out the forecast period.
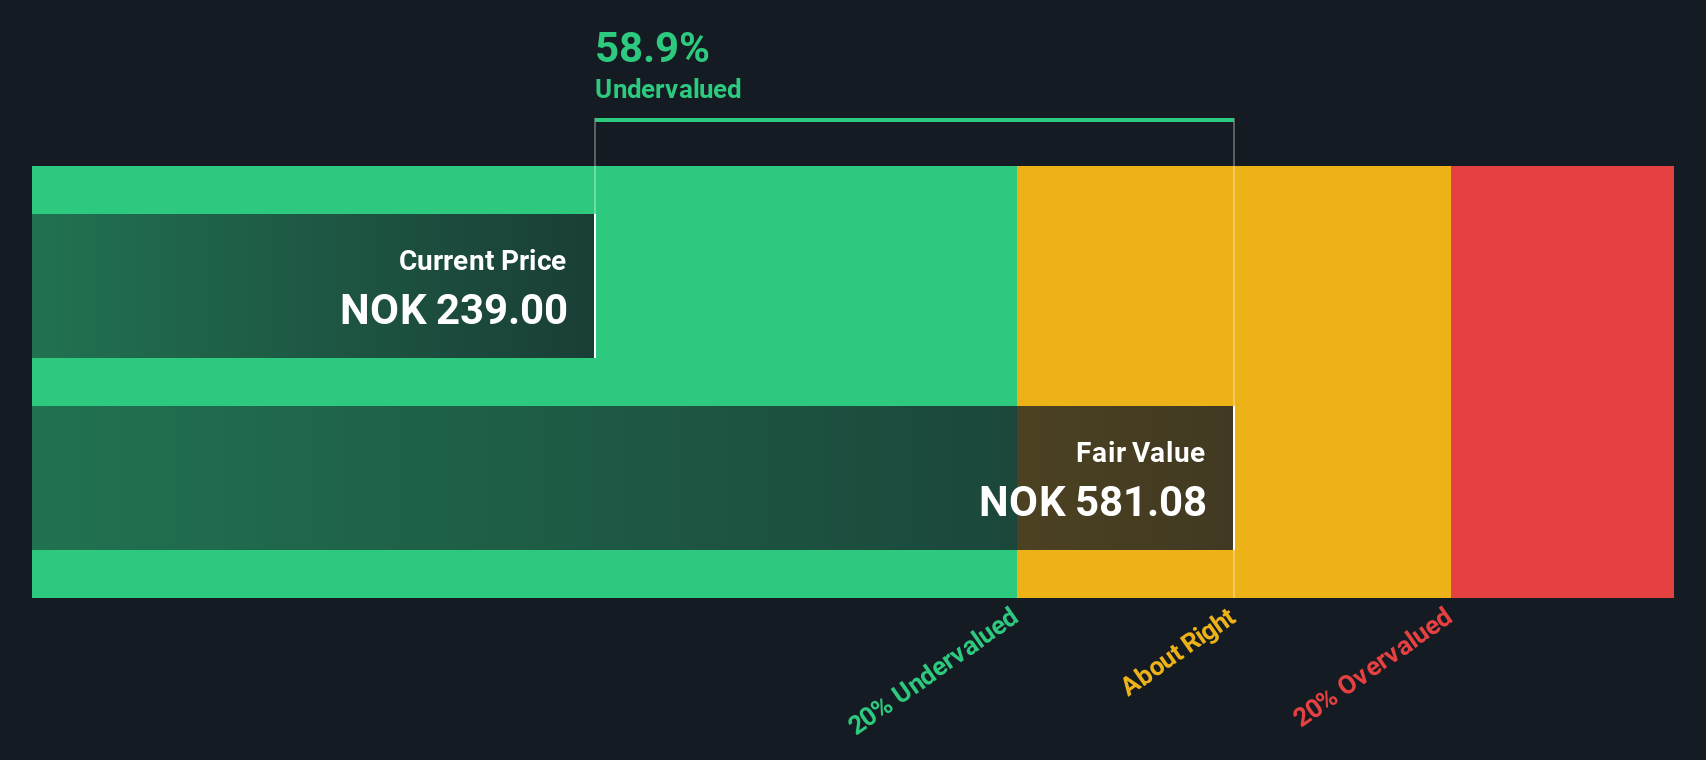
When all these future cash flows are added up and appropriately discounted, the model estimates an intrinsic value per share of 624.93 NOK. With the current share price carrying a substantial 61.1% discount to this value, the DCF suggests that Equinor is significantly undervalued by the market at the moment.
Result: UNDERVALUED
Our Discounted Cash Flow (DCF) analysis suggests Equinor is undervalued by 61.1%. Track this in your watchlist or portfolio, or discover 841 more undervalued stocks based on cash flows.
Approach 2: Equinor Price vs Earnings
The Price-to-Earnings (PE) ratio is commonly used to value profitable companies like Equinor, as it relates the current share price to the earnings generated over the past year. It gives investors a straightforward way to judge how much the market is willing to pay for each unit of recent profit.
What counts as a fair PE ratio often depends on expectations for future growth and the perceived risk of the company. Generally, companies with higher growth prospects or lower risk are rewarded with higher PE ratios, while those facing greater uncertainty or slower growth tend to trade at lower multiples.
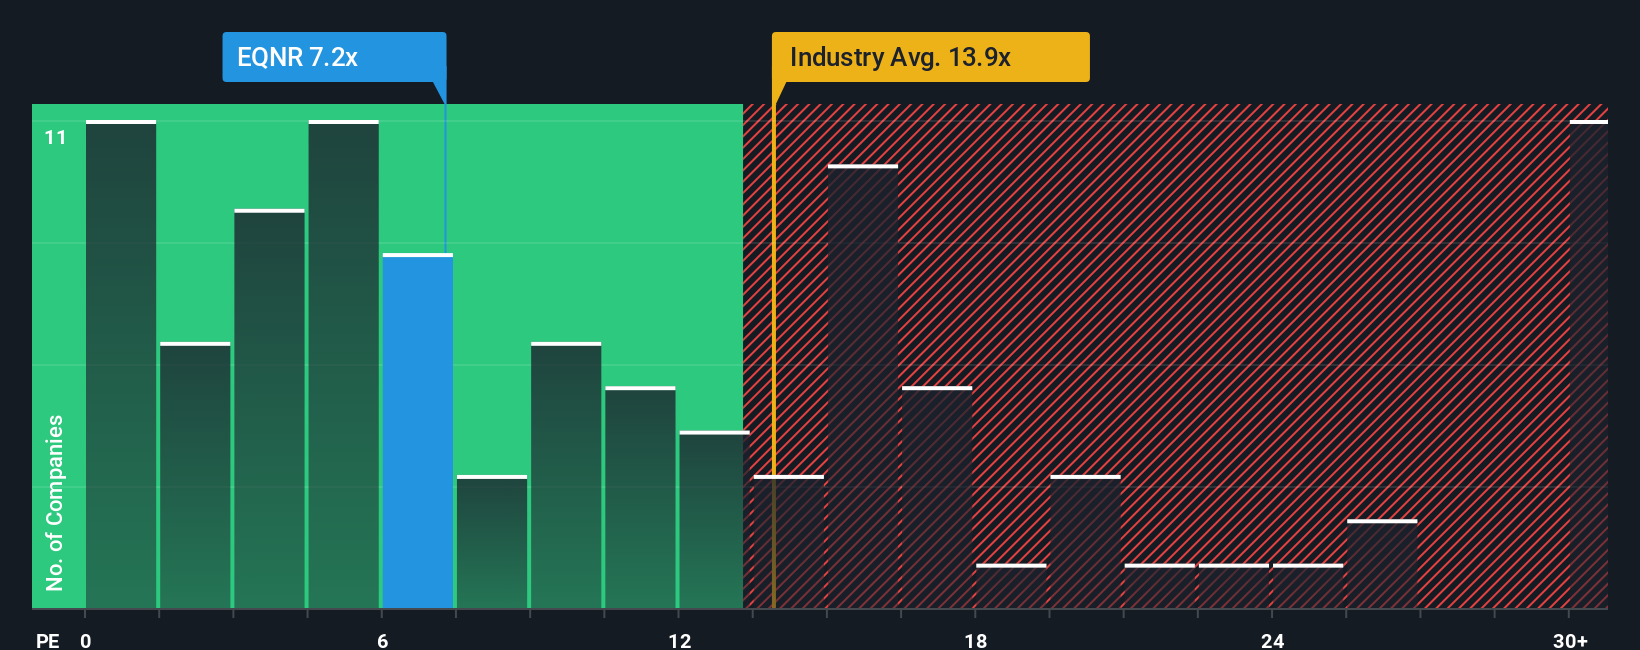
Equinor currently trades on a PE ratio of 10.46x. This is below both the average for the Oil and Gas industry, which stands at 13.04x, and the average for its direct peers at 14.32x. On the surface, this suggests Equinor is trading at a discount compared to similar companies in its space.
Simply Wall St’s proprietary Fair Ratio for Equinor is 10.23x. This figure goes beyond basic peer and industry comparisons. It factors in specific variables like Equinor’s earnings growth, profit margins, industry context, market cap and company-specific risks, painting a more accurate and tailored picture of what constitutes a fair valuation for this stock.
With Equinor’s actual PE ratio of 10.46x coming in very close to its Fair Ratio of 10.23x, the evidence suggests that the stock is roughly priced in line with its fundamentals at the moment.
Result: ABOUT RIGHT
PE ratios tell one story, but what if the real opportunity lies elsewhere? Discover 1411 companies where insiders are betting big on explosive growth.
Upgrade Your Decision Making: Choose your Equinor Narrative
Earlier we mentioned that there is an even better way to understand valuation, so let's introduce you to Narratives. A Narrative is your personalized story or viewpoint about a company, where you make your own assumptions about Equinor's future revenue, earnings, and profit margins to arrive at a fair value. Narratives connect this story directly to a financial forecast and a fair value calculation, transforming the raw numbers into insights that fit your perspective on the company's prospects.
Available right on the Simply Wall St Community page, Narratives make it easy for investors of any experience level to build, adjust, and track their investment theses. You can instantly see whether your view of Equinor’s fair value suggests it is a buy or a sell compared to the market price. Plus, as new information comes in, like earnings results or news updates, your Narrative automatically refreshes, ensuring your assessment is always based on the latest data.
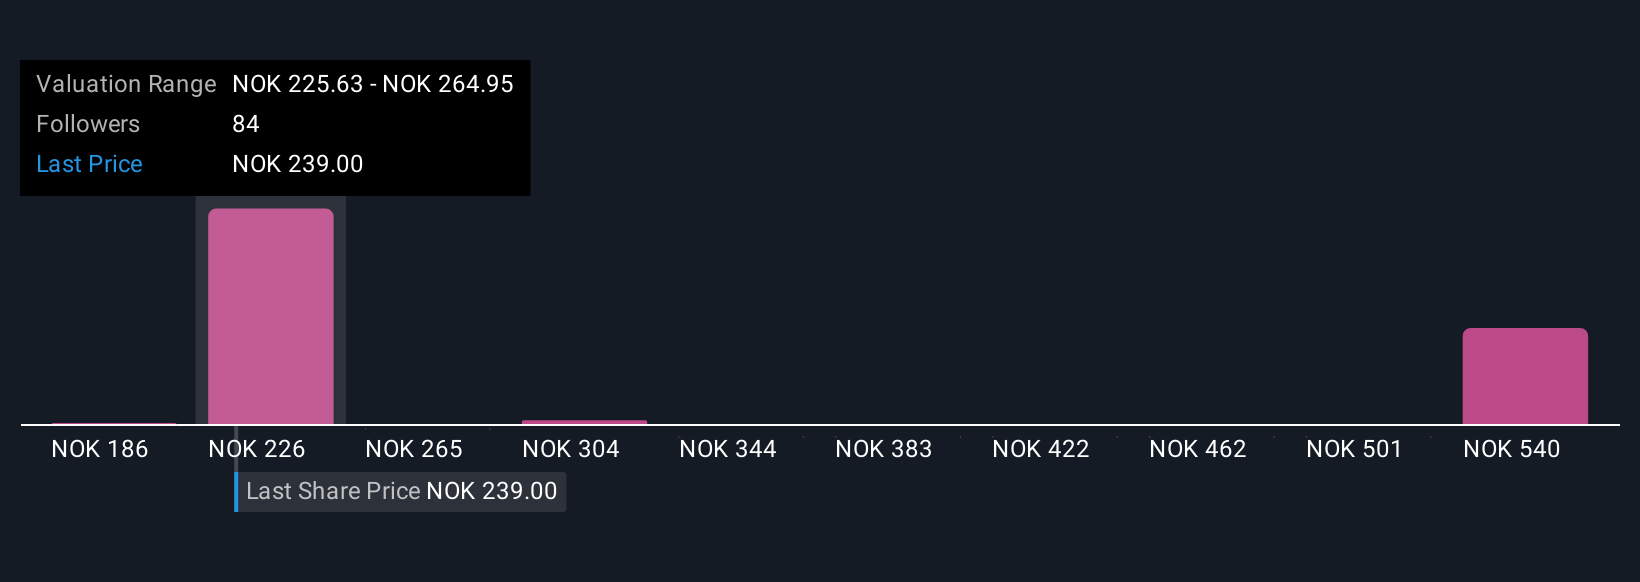
For Equinor, one Narrative might see overvaluation risk if renewables grow slower and oil and gas faces sharper decline, supporting a bearish price target around NOK 179.69. A more optimistic Narrative could highlight resilient gas contracts and successful project delivery, justifying a price target as high as NOK 320.92.
Do you think there's more to the story for Equinor? Head over to our Community to see what others are saying!
This article by Simply Wall St is general in nature. We provide commentary based on historical data and analyst forecasts only using an unbiased methodology and our articles are not intended to be financial advice. It does not constitute a recommendation to buy or sell any stock, and does not take account of your objectives, or your financial situation. We aim to bring you long-term focused analysis driven by fundamental data. Note that our analysis may not factor in the latest price-sensitive company announcements or qualitative material. Simply Wall St has no position in any stocks mentioned.
Valuation is complex, but we're here to simplify it.
Discover if Equinor might be undervalued or overvalued with our detailed analysis, featuring fair value estimates, potential risks, dividends, insider trades, and its financial condition.
Access Free AnalysisHave feedback on this article? Concerned about the content? Get in touch with us directly. Alternatively, email editorial-team@simplywallst.com
About OB:EQNR
Equinor
An energy company, engages in the exploration, production, transportation, refining, and marketing of petroleum and other forms of energy in Norway and internationally.
Excellent balance sheet, good value and pays a dividend.
Similar Companies
Market Insights

Advertisement
Community Narratives
The company that turned a verb into a global necessity and basically runs the modern internet, digital ads, smartphones, maps, and AI.
Fair Value US$300.00|7.5% undervalued
OS
Community Contributor
Flowers Foods Pays A Fair Price For Health
Fair Value US$16.12|25.4% undervalued
NV
Community Contributor
TMX Group will thrive with 33.3% profit margin and enduring market moat
Fair Value CA$49.90|3.6% overvalued
LI
Community Contributor
The "Molecular Pencil": Why Beam's Technology is Built to Win
Fair Value US$65.01|65.0% undervalued
DA
Community Contributor