
Advertisement
- Norway
- /
- Oil and Gas
- /
- OB:BWLPG
BWG (OB:BWLPG) shareholders notch a 57% CAGR over 5 years, yet earnings have been shrinking
When you buy shares in a company, it's worth keeping in mind the possibility that it could fail, and you could lose your money. But on a lighter note, a good company can see its share price rise well over 100%. One great example is BW LPG Limited (OB:BWLPG) which saw its share price drive 300% higher over five years. It's also good to see the share price up 28% over the last quarter. But this could be related to the strong market, which is up 14% in the last three months.
Since it's been a strong week for BWG shareholders, let's have a look at trend of the longer term fundamentals.
There is no denying that markets are sometimes efficient, but prices do not always reflect underlying business performance. By comparing earnings per share (EPS) and share price changes over time, we can get a feel for how investor attitudes to a company have morphed over time.
BWG's earnings per share are down 8.9% per year, despite strong share price performance over five years.
Essentially, it doesn't seem likely that investors are focused on EPS. Since the change in EPS doesn't seem to correlate with the change in share price, it's worth taking a look at other metrics.
In fact, the dividend has increased over time, which is a positive. It could be that the company is reaching maturity and dividend investors are buying for the yield. We'd posit that the revenue growth over the last five years, of 34% per year, would encourage people to invest.
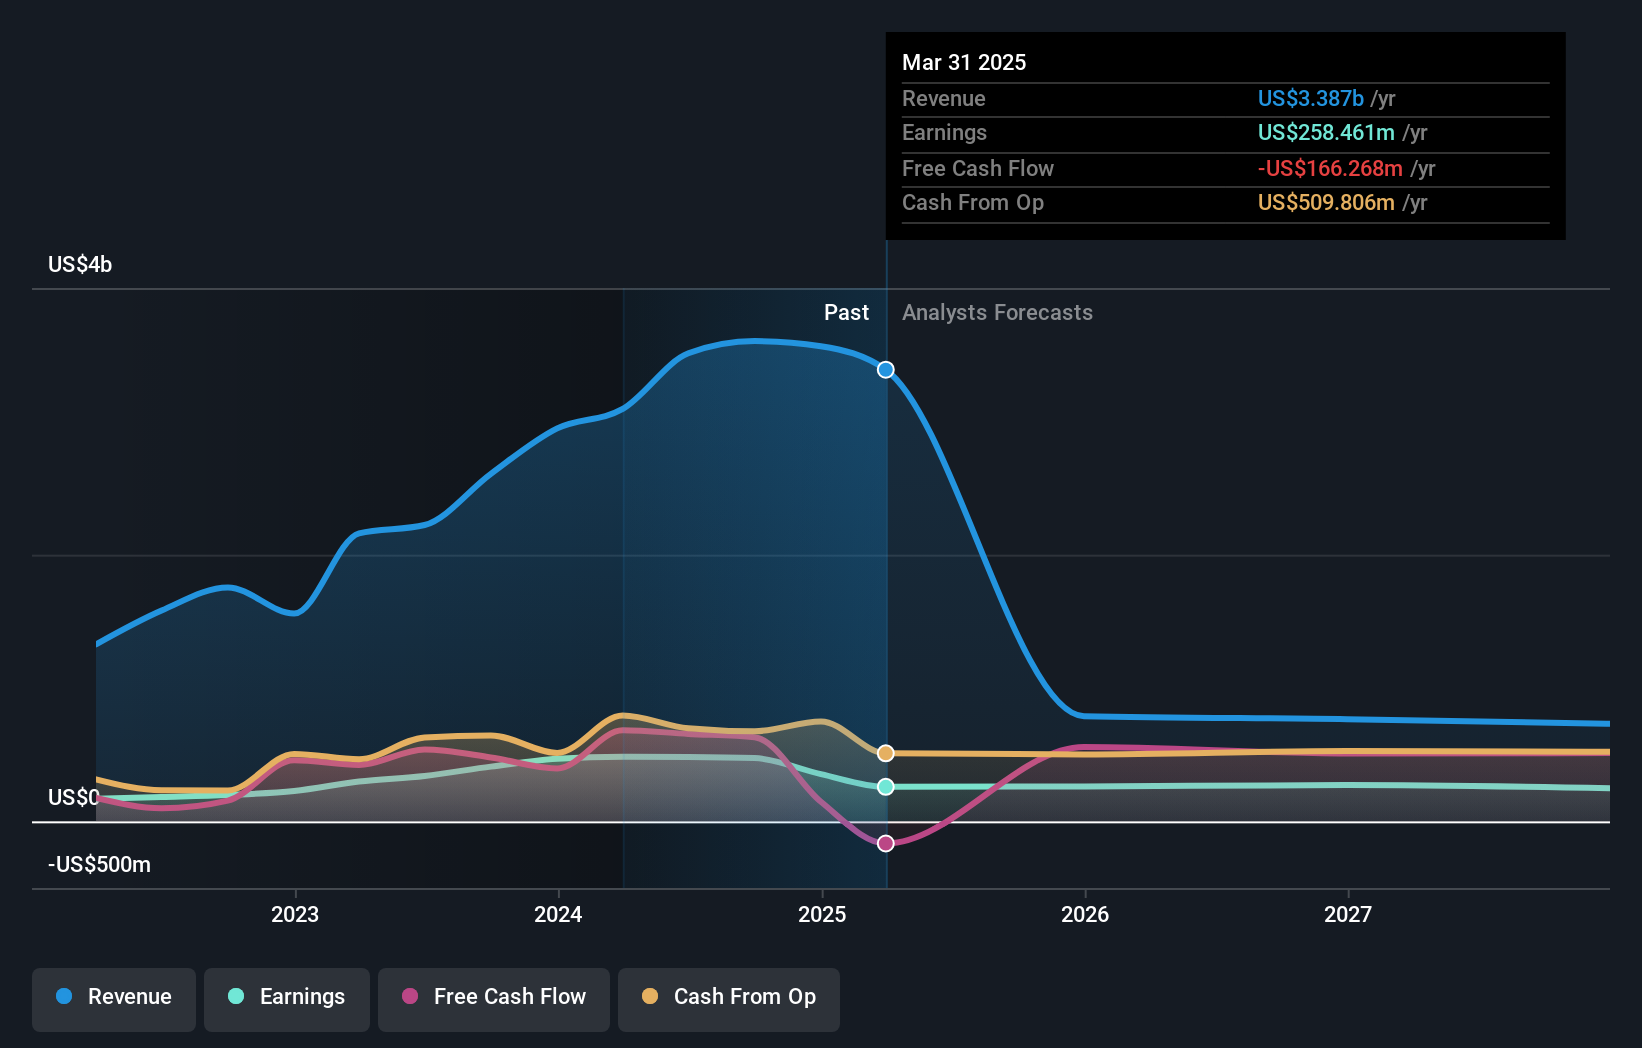
The graphic below depicts how earnings and revenue have changed over time (unveil the exact values by clicking on the image).
Take a more thorough look at BWG's financial health with this free report on its balance sheet.
What About Dividends?
When looking at investment returns, it is important to consider the difference between total shareholder return (TSR) and share price return. Whereas the share price return only reflects the change in the share price, the TSR includes the value of dividends (assuming they were reinvested) and the benefit of any discounted capital raising or spin-off. Arguably, the TSR gives a more comprehensive picture of the return generated by a stock. We note that for BWG the TSR over the last 5 years was 855%, which is better than the share price return mentioned above. The dividends paid by the company have thusly boosted the total shareholder return.
A Different Perspective
While the broader market gained around 15% in the last year, BWG shareholders lost 23% (even including dividends). However, keep in mind that even the best stocks will sometimes underperform the market over a twelve month period. Longer term investors wouldn't be so upset, since they would have made 57%, each year, over five years. If the fundamental data continues to indicate long term sustainable growth, the current sell-off could be an opportunity worth considering. It's always interesting to track share price performance over the longer term. But to understand BWG better, we need to consider many other factors. Even so, be aware that BWG is showing 4 warning signs in our investment analysis , and 3 of those are a bit unpleasant...
But note: BWG may not be the best stock to buy. So take a peek at this free list of interesting companies with past earnings growth (and further growth forecast).
Please note, the market returns quoted in this article reflect the market weighted average returns of stocks that currently trade on Norwegian exchanges.
Valuation is complex, but we're here to simplify it.
Discover if BWG might be undervalued or overvalued with our detailed analysis, featuring fair value estimates, potential risks, dividends, insider trades, and its financial condition.
Access Free AnalysisHave feedback on this article? Concerned about the content? Get in touch with us directly. Alternatively, email editorial-team (at) simplywallst.com.
This article by Simply Wall St is general in nature. We provide commentary based on historical data and analyst forecasts only using an unbiased methodology and our articles are not intended to be financial advice. It does not constitute a recommendation to buy or sell any stock, and does not take account of your objectives, or your financial situation. We aim to bring you long-term focused analysis driven by fundamental data. Note that our analysis may not factor in the latest price-sensitive company announcements or qualitative material. Simply Wall St has no position in any stocks mentioned.
About OB:BWLPG
BWG
An investment holding company, engages in ship owning and chartering activities worldwide.
Undervalued with excellent balance sheet and pays a dividend.
Similar Companies
Market Insights

Advertisement
Community Narratives
MINISO's fair value is projected at 26.69 with an anticipated PE ratio shift of 20x
Fair Value US$24.03|9.0% undervalued
BE
Community Contributor
Procter & Gamble: A Dividend Giant Facing Slowing Growth
Fair Value US$119.81|23.5% overvalued
AN
Community Contributor
Eli Lilly's Future Growth Driven by Tirzepatide and Favorable Market Conditions
Fair Value US$1.19k|14.4% undervalued
EA
Community Contributor