
Advertisement
- Norway
- /
- Oil and Gas
- /
- OB:ALNG
More Unpleasant Surprises Could Be In Store For Awilco LNG ASA's (OB:ALNG) Shares After Tumbling 27%
The Awilco LNG ASA (OB:ALNG) share price has fared very poorly over the last month, falling by a substantial 27%. The recent drop completes a disastrous twelve months for shareholders, who are sitting on a 53% loss during that time.
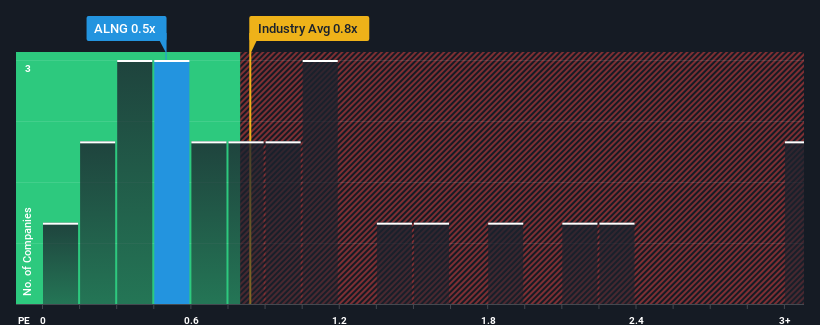
Even after such a large drop in price, there still wouldn't be many who think Awilco LNG's price-to-sales (or "P/S") ratio of 0.5x is worth a mention when the median P/S in Norway's Oil and Gas industry is similar at about 0.8x. However, investors might be overlooking a clear opportunity or potential setback if there is no rational basis for the P/S.
See our latest analysis for Awilco LNG
What Does Awilco LNG's P/S Mean For Shareholders?
Awilco LNG certainly has been doing a good job lately as its revenue growth has been positive while most other companies have been seeing their revenue go backwards. One possibility is that the P/S ratio is moderate because investors think the company's revenue will be less resilient moving forward. If not, then existing shareholders have reason to be feeling optimistic about the future direction of the share price.
Want the full picture on analyst estimates for the company? Then our free report on Awilco LNG will help you uncover what's on the horizon.How Is Awilco LNG's Revenue Growth Trending?
Awilco LNG's P/S ratio would be typical for a company that's only expected to deliver moderate growth, and importantly, perform in line with the industry.
Taking a look back first, we see that the company managed to grow revenues by a handy 5.5% last year. The latest three year period has also seen an excellent 37% overall rise in revenue, aided somewhat by its short-term performance. Therefore, it's fair to say the revenue growth recently has been superb for the company.
Looking ahead now, revenue is anticipated to plummet, contracting by 38% during the coming year according to the only analyst following the company. The industry is also set to see revenue decline 1.4% but the stock is shaping up to perform materially worse.
With this in mind, we find it intriguing that Awilco LNG's P/S is similar to its industry peers. With revenue going quickly in reverse, it's not guaranteed that the P/S has found a floor yet. There's potential for the P/S to fall to lower levels if the company doesn't improve its top-line growth.
What Does Awilco LNG's P/S Mean For Investors?
Following Awilco LNG's share price tumble, its P/S is just clinging on to the industry median P/S. While the price-to-sales ratio shouldn't be the defining factor in whether you buy a stock or not, it's quite a capable barometer of revenue expectations.
Awilco LNG currently trades on a higher P/S than expected based on revenue decline, even more so since its revenue forecast is even worse than the struggling industry. It's not unusual in cases where revenue growth is poor, that the share price declines, sending the moderate P/S lower relative to the industry. We also have our reservations about the company's ability to sustain this level of performance amidst the challenging industry conditions. This places shareholders' investments at risk and potential investors in danger of paying an unnecessary premium.
It's always necessary to consider the ever-present spectre of investment risk. We've identified 3 warning signs with Awilco LNG (at least 1 which makes us a bit uncomfortable), and understanding these should be part of your investment process.
If strong companies turning a profit tickle your fancy, then you'll want to check out this free list of interesting companies that trade on a low P/E (but have proven they can grow earnings).
New: Manage All Your Stock Portfolios in One Place
We've created the ultimate portfolio companion for stock investors, and it's free.
• Connect an unlimited number of Portfolios and see your total in one currency
• Be alerted to new Warning Signs or Risks via email or mobile
• Track the Fair Value of your stocks
Have feedback on this article? Concerned about the content? Get in touch with us directly. Alternatively, email editorial-team (at) simplywallst.com.
This article by Simply Wall St is general in nature. We provide commentary based on historical data and analyst forecasts only using an unbiased methodology and our articles are not intended to be financial advice. It does not constitute a recommendation to buy or sell any stock, and does not take account of your objectives, or your financial situation. We aim to bring you long-term focused analysis driven by fundamental data. Note that our analysis may not factor in the latest price-sensitive company announcements or qualitative material. Simply Wall St has no position in any stocks mentioned.
About OB:ALNG
Awilco LNG
Owns and operates liquefied natural gas (LNG) vessels in Norway.
Undervalued with excellent balance sheet.
Similar Companies
Market Insights

Advertisement
Community Narratives
MINISO's fair value is projected at 26.69 with an anticipated PE ratio shift of 20x
Fair Value US$24.03|11.0% undervalued
BE
Community Contributor
Procter & Gamble: A Dividend Giant Facing Slowing Growth
Fair Value US$119.81|23.3% overvalued
AN
Community Contributor
Eli Lilly's Future Growth Driven by Tirzepatide and Favorable Market Conditions
Fair Value US$1.19k|13.8% undervalued
EA
Community Contributor