
Advertisement
- Norway
- /
- Commercial Services
- /
- OB:AKH
The Market Lifts Aker Horizons ASA (OB:AKH) Shares 31% But It Can Do More

Aker Horizons ASA (OB:AKH) shareholders are no doubt pleased to see that the share price has bounced 31% in the last month, although it is still struggling to make up recently lost ground. Still, the 30-day jump doesn't change the fact that longer term shareholders have seen their stock decimated by the 56% share price drop in the last twelve months.
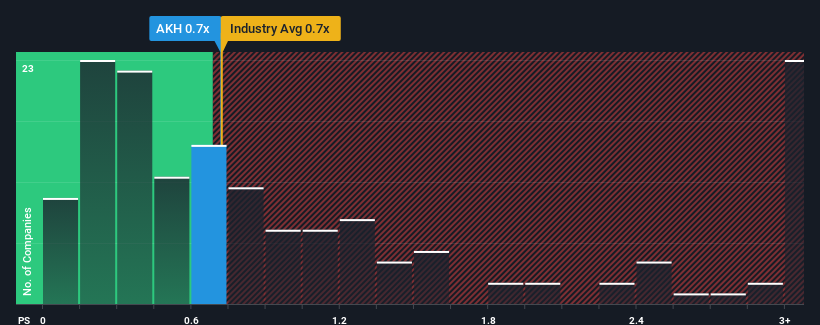
In spite of the firm bounce in price, Aker Horizons' price-to-sales (or "P/S") ratio of 0.7x might still make it look like a buy right now compared to the Commercial Services industry in Norway, where around half of the companies have P/S ratios above 2.5x and even P/S above 27x are quite common. Nonetheless, we'd need to dig a little deeper to determine if there is a rational basis for the reduced P/S.
See our latest analysis for Aker Horizons
What Does Aker Horizons' P/S Mean For Shareholders?
Recent times have been quite advantageous for Aker Horizons as its revenue has been rising very briskly. One possibility is that the P/S ratio is low because investors think this strong revenue growth might actually underperform the broader industry in the near future. Those who are bullish on Aker Horizons will be hoping that this isn't the case, so that they can pick up the stock at a lower valuation.
Although there are no analyst estimates available for Aker Horizons, take a look at this free data-rich visualisation to see how the company stacks up on earnings, revenue and cash flow.Do Revenue Forecasts Match The Low P/S Ratio?
In order to justify its P/S ratio, Aker Horizons would need to produce sluggish growth that's trailing the industry.
Retrospectively, the last year delivered an exceptional 54% gain to the company's top line. Spectacularly, three year revenue growth has ballooned by several orders of magnitude, thanks in part to the last 12 months of revenue growth. So we can start by confirming that the company has done a tremendous job of growing revenue over that time.
When compared to the industry's one-year growth forecast of 9.1%, the most recent medium-term revenue trajectory is noticeably more alluring
With this information, we find it odd that Aker Horizons is trading at a P/S lower than the industry. It looks like most investors are not convinced the company can maintain its recent growth rates.
The Final Word
The latest share price surge wasn't enough to lift Aker Horizons' P/S close to the industry median. We'd say the price-to-sales ratio's power isn't primarily as a valuation instrument but rather to gauge current investor sentiment and future expectations.
We're very surprised to see Aker Horizons currently trading on a much lower than expected P/S since its recent three-year growth is higher than the wider industry forecast. When we see strong revenue with faster-than-industry growth, we assume there are some significant underlying risks to the company's ability to make money which is applying downwards pressure on the P/S ratio. At least price risks look to be very low if recent medium-term revenue trends continue, but investors seem to think future revenue could see a lot of volatility.
Before you settle on your opinion, we've discovered 3 warning signs for Aker Horizons (2 don't sit too well with us!) that you should be aware of.
Of course, profitable companies with a history of great earnings growth are generally safer bets. So you may wish to see this free collection of other companies that have reasonable P/E ratios and have grown earnings strongly.
New: Manage All Your Stock Portfolios in One Place
We've created the ultimate portfolio companion for stock investors, and it's free.
• Connect an unlimited number of Portfolios and see your total in one currency
• Be alerted to new Warning Signs or Risks via email or mobile
• Track the Fair Value of your stocks
Have feedback on this article? Concerned about the content? Get in touch with us directly. Alternatively, email editorial-team (at) simplywallst.com.
This article by Simply Wall St is general in nature. We provide commentary based on historical data and analyst forecasts only using an unbiased methodology and our articles are not intended to be financial advice. It does not constitute a recommendation to buy or sell any stock, and does not take account of your objectives, or your financial situation. We aim to bring you long-term focused analysis driven by fundamental data. Note that our analysis may not factor in the latest price-sensitive company announcements or qualitative material. Simply Wall St has no position in any stocks mentioned.
About OB:AKH
Aker Horizons
Through its subsidiaries, develops and invests in renewable energy and green technology private and public companies worldwide.
Mediocre balance sheet and slightly overvalued.
Market Insights


Advertisement
Community Narratives
A case for TSXV:USA to reach USD $5.00 - $9.00 (CAD $7.30–$12.29) by 2029.
Fair Value CA$12.29|91.1% undervalued
AG
Community Contributor
DLocal's Future Growth Fueled by 35% Revenue and Profit Margin Boosts
Fair Value US$195.39|94.2% undervalued
WY
Community Contributor
Historically Cheap, but the Margin of Safety Is Still Thin
Fair Value SEK 232.58|13.2% undervalued
MA
Community Contributor